29
/
en
AIzaSyAYiBZKx7MnpbEhh9jyipgxe19OcubqV5w
April 1, 2024
266120
Tonga
TON
true
2
1
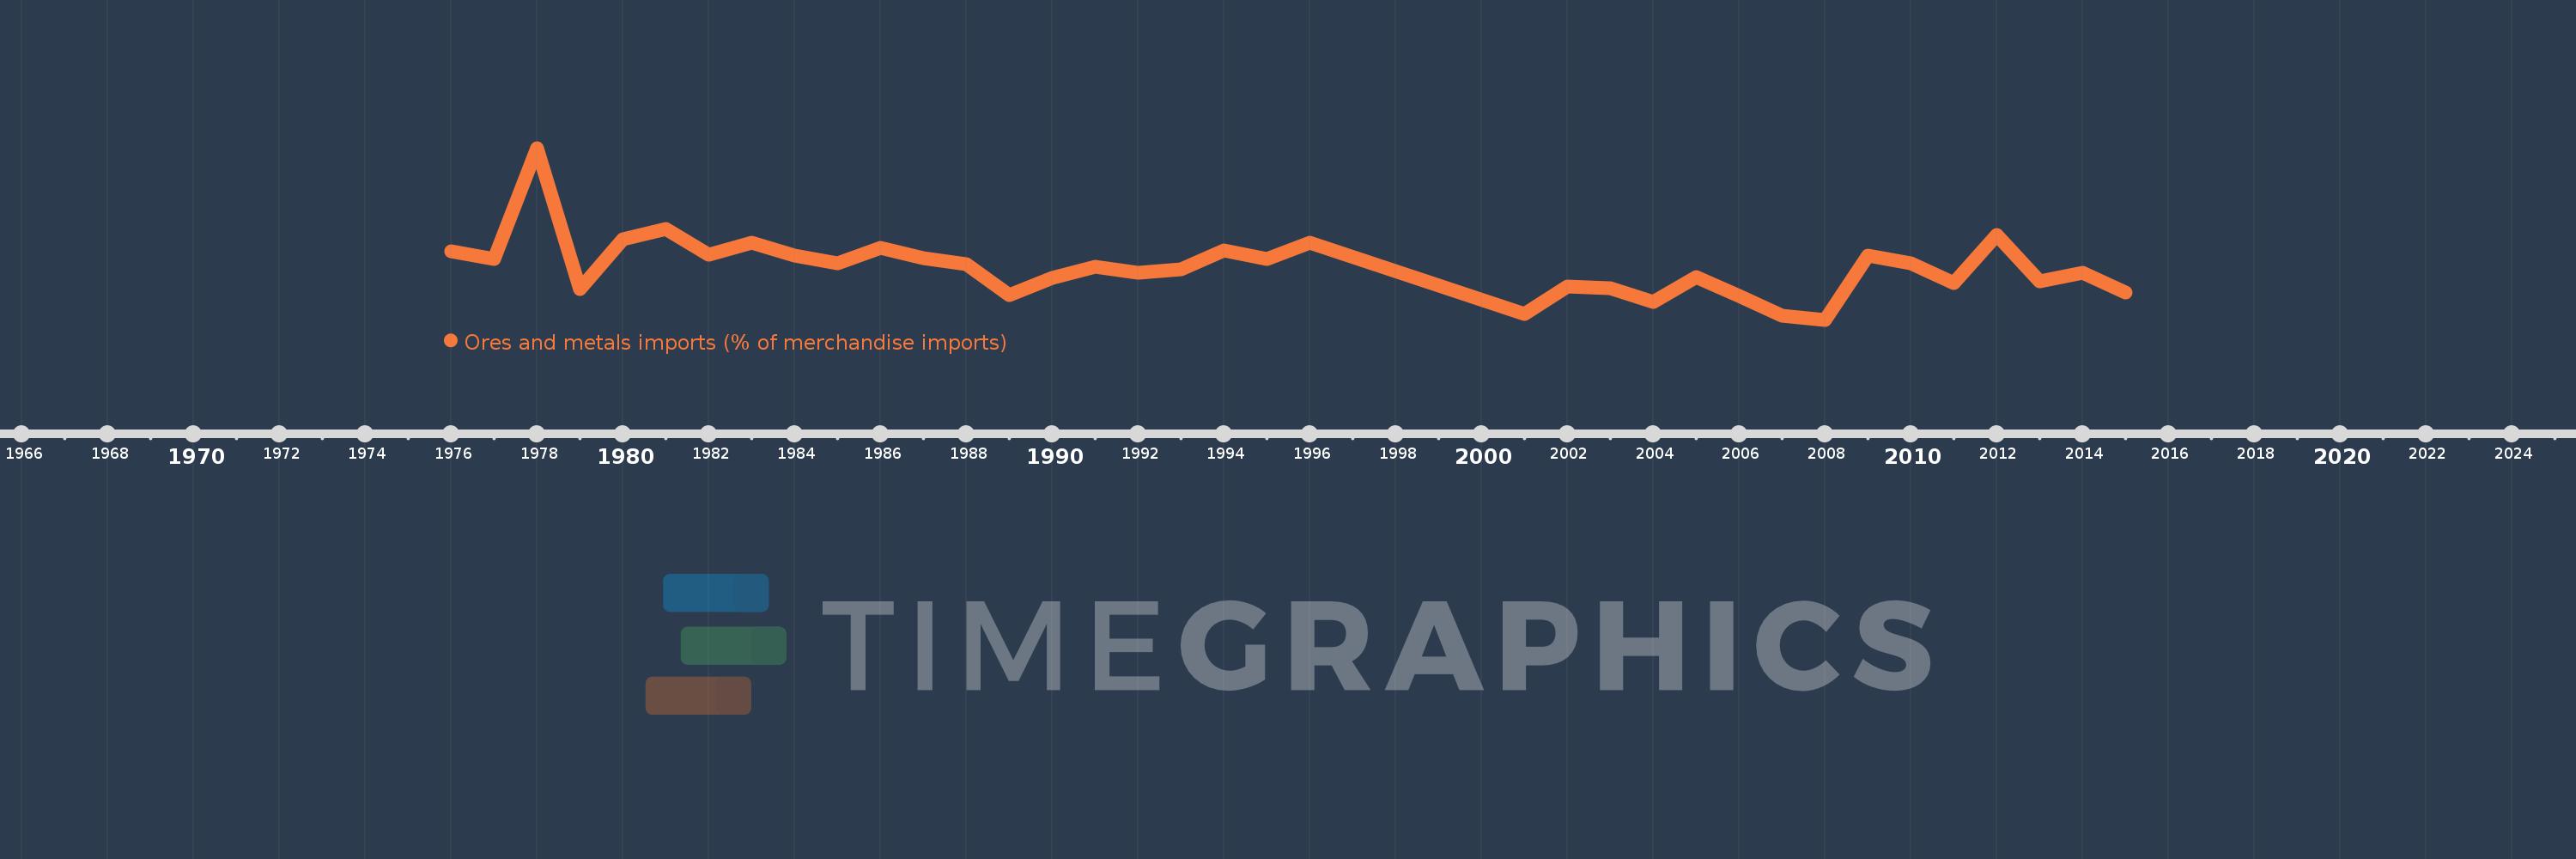
Ores and metals imports (% of merchandise imports)
2015,2014,2013,2012,2011,2010,2009,2008,2007,2006,2005,2004,2003,2002,2001,1996,1995,1994,1993,1992,1991,1990,1989,1988,1987,1986,1985,1984,1983,1982,1981,1980,1979,1978,1977,1976
This statistics in other country:
AfghanistanAlbaniaAlgeriaAndorraAngolaAntigua and BarbudaArab WorldArgentinaArmeniaArubaAustraliaAustriaAzerbaijanBahamas, TheBahrainBangladeshBarbadosBelarusBelgiumBelizeBeninBermudaBhutanBoliviaBosnia and HerzegovinaBotswanaBrazilBrunei DarussalamBulgariaBurkina FasoBurundiCabo VerdeCambodiaCameroonCanadaCaribbean small statesCayman IslandsCentral African RepublicCentral Europe and the BalticsChadChileChinaColombiaComorosCongo, Dem. Rep.Congo, Rep.Costa RicaCote d'IvoireCroatiaCubaCyprusCzech RepublicDenmarkDjiboutiDominicaDominican RepublicEarly-demographic dividendEast Asia & PacificEast Asia & Pacific (excluding high income)East Asia & Pacific (IDA & IBRD countries)EcuadorEgypt, Arab Rep.El SalvadorEquatorial GuineaEritreaEstoniaEthiopiaEuro areaEurope & Central AsiaEurope & Central Asia (excluding high income)Europe & Central Asia (IDA & IBRD countries)European UnionFaroe IslandsFijiFinlandFragile and conflict affected situationsFranceFrench PolynesiaGabonGambia, TheGeorgiaGermanyGhanaGreeceGreenlandGrenadaGuatemalaGuineaGuinea-BissauGuyanaHaitiHeavily indebted poor countries (HIPC)High incomeHondurasHong Kong SAR, ChinaHungaryIBRD onlyIcelandIDA & IBRD totalIDA blendIDA onlyIDA totalIndiaIndonesiaIran, Islamic Rep.IraqIrelandIsraelItalyJamaicaJapanJordanKazakhstanKenyaKiribatiKorea, Rep.KuwaitKyrgyz RepublicLao PDRLate-demographic dividendLatin America & Caribbean Latin America & Caribbean (excluding high income)Latin America & the Caribbean (IDA & IBRD countries)LatviaLeast developed countries: UN classificationLebanonLesothoLiberiaLibyaLithuaniaLow & middle incomeLow incomeLower middle incomeLuxembourgMacao SAR, ChinaMacedonia, FYRMadagascarMalawiMalaysiaMaldivesMaliMaltaMauritaniaMauritiusMexicoMiddle East & North AfricaMiddle East & North Africa (excluding high income)Middle East & North Africa (IDA & IBRD countries)Middle incomeMoldovaMongoliaMoroccoMozambiqueMyanmarNamibiaNepalNetherlandsNew CaledoniaNew ZealandNicaraguaNigerNigeriaNorth AmericaNorwayOECD membersOmanOther small statesPacific island small statesPakistanPalauPanamaPapua New GuineaParaguayPeruPhilippinesPolandPortugalPost-demographic dividendPre-demographic dividendQatarRomaniaRussian FederationRwandaSamoaSao Tome and PrincipeSaudi ArabiaSenegalSerbiaSeychellesSierra LeoneSingaporeSlovak RepublicSloveniaSmall statesSolomon IslandsSomaliaSouth AfricaSouth AsiaSouth Asia (IDA & IBRD)SpainSri LankaSt. Kitts and NevisSt. LuciaSt. Vincent and the GrenadinesSub-Saharan Africa Sub-Saharan Africa (excluding high income)Sub-Saharan Africa (IDA & IBRD countries)SudanSurinameSwazilandSwedenSwitzerlandSyrian Arab RepublicTajikistanTanzaniaThailandTimor-LesteTogoTongaTrinidad and TobagoTunisiaTurkeyTurkmenistanTurks and Caicos IslandsTuvaluUgandaUkraineUnited Arab EmiratesUnited KingdomUnited StatesUpper middle incomeUruguayVanuatuVenezuela, RBVietnamVirgin Islands (U.S.)WorldYemen, Rep.ZambiaZimbabwe Timeline:
This timeline shows a graph from 1976 to 2015 of Tonga. No data until 1975. Number of actual observations by date: 36.
Source name:
World Development Indicators
Source organization:
World Bank staff estimates from the Comtrade database maintained by the United Nations Statistics Division.
Categories, topics:
Energy & Mining, Private Sector, Trade
Last updated:
apr 23, 2017
Indicators value changes by year
At the date of observation
Value
Absolute change
Change from previous value
jan 1, 1976
0.795
+0.795
0.0%
jan 1, 1977
0.721
-0.074
-9.29%
jan 1, 1978
1.775
+1.054
146.14%
jan 1, 1979
0.435
-1.34
-75.49%
jan 1, 1980
0.903
+0.468
107.58%
jan 1, 1981
1.005
+0.102
11.34%
jan 1, 1982
0.764
-0.241
-24.02%
jan 1, 1983
0.874
+0.11
14.36%
jan 1, 1984
0.751
-0.123
-14.02%
jan 1, 1985
0.68
-0.071
-9.5%
jan 1, 1986
0.828
+0.148
21.76%
jan 1, 1987
0.726
-0.102
-12.34%
jan 1, 1988
0.673
-0.052
-7.23%
jan 1, 1989
0.377
-0.296
-44.03%
jan 1, 1990
0.537
+0.161
42.67%
jan 1, 1991
0.649
+0.111
20.71%
jan 1, 1992
0.59
-0.058
-9.0%
jan 1, 1993
0.623
+0.033
5.53%
jan 1, 1994
0.799
+0.176
28.18%
jan 1, 1995
0.718
-0.08
-10.05%
jan 1, 1996
0.875
+0.157
21.86%
jan 1, 2001
0.196
-0.679
-77.61%
jan 1, 2002
0.458
+0.262
133.63%
jan 1, 2003
0.438
-0.02
-4.37%
jan 1, 2004
0.31
-0.128
-29.25%
jan 1, 2005
0.546
+0.236
76.29%
jan 1, 2006
0.368
-0.178
-32.61%
jan 1, 2007
0.183
-0.185
-50.21%
jan 1, 2008
0.142
-0.041
-22.53%
jan 1, 2009
0.749
+0.607
427.82%
jan 1, 2010
0.682
-0.067
-8.94%
jan 1, 2011
0.491
-0.191
-27.97%
jan 1, 2012
0.945
+0.453
92.21%
jan 1, 2013
0.507
-0.437
-46.29%
jan 1, 2014
0.59
+0.083
16.39%
jan 1, 2015
0.402
-0.188
-31.84%
Ranking of countries by current statistics by years


Comments: