29
/
en
AIzaSyAYiBZKx7MnpbEhh9jyipgxe19OcubqV5w
April 1, 2024
91597
Brazil
BRA
true
2
1
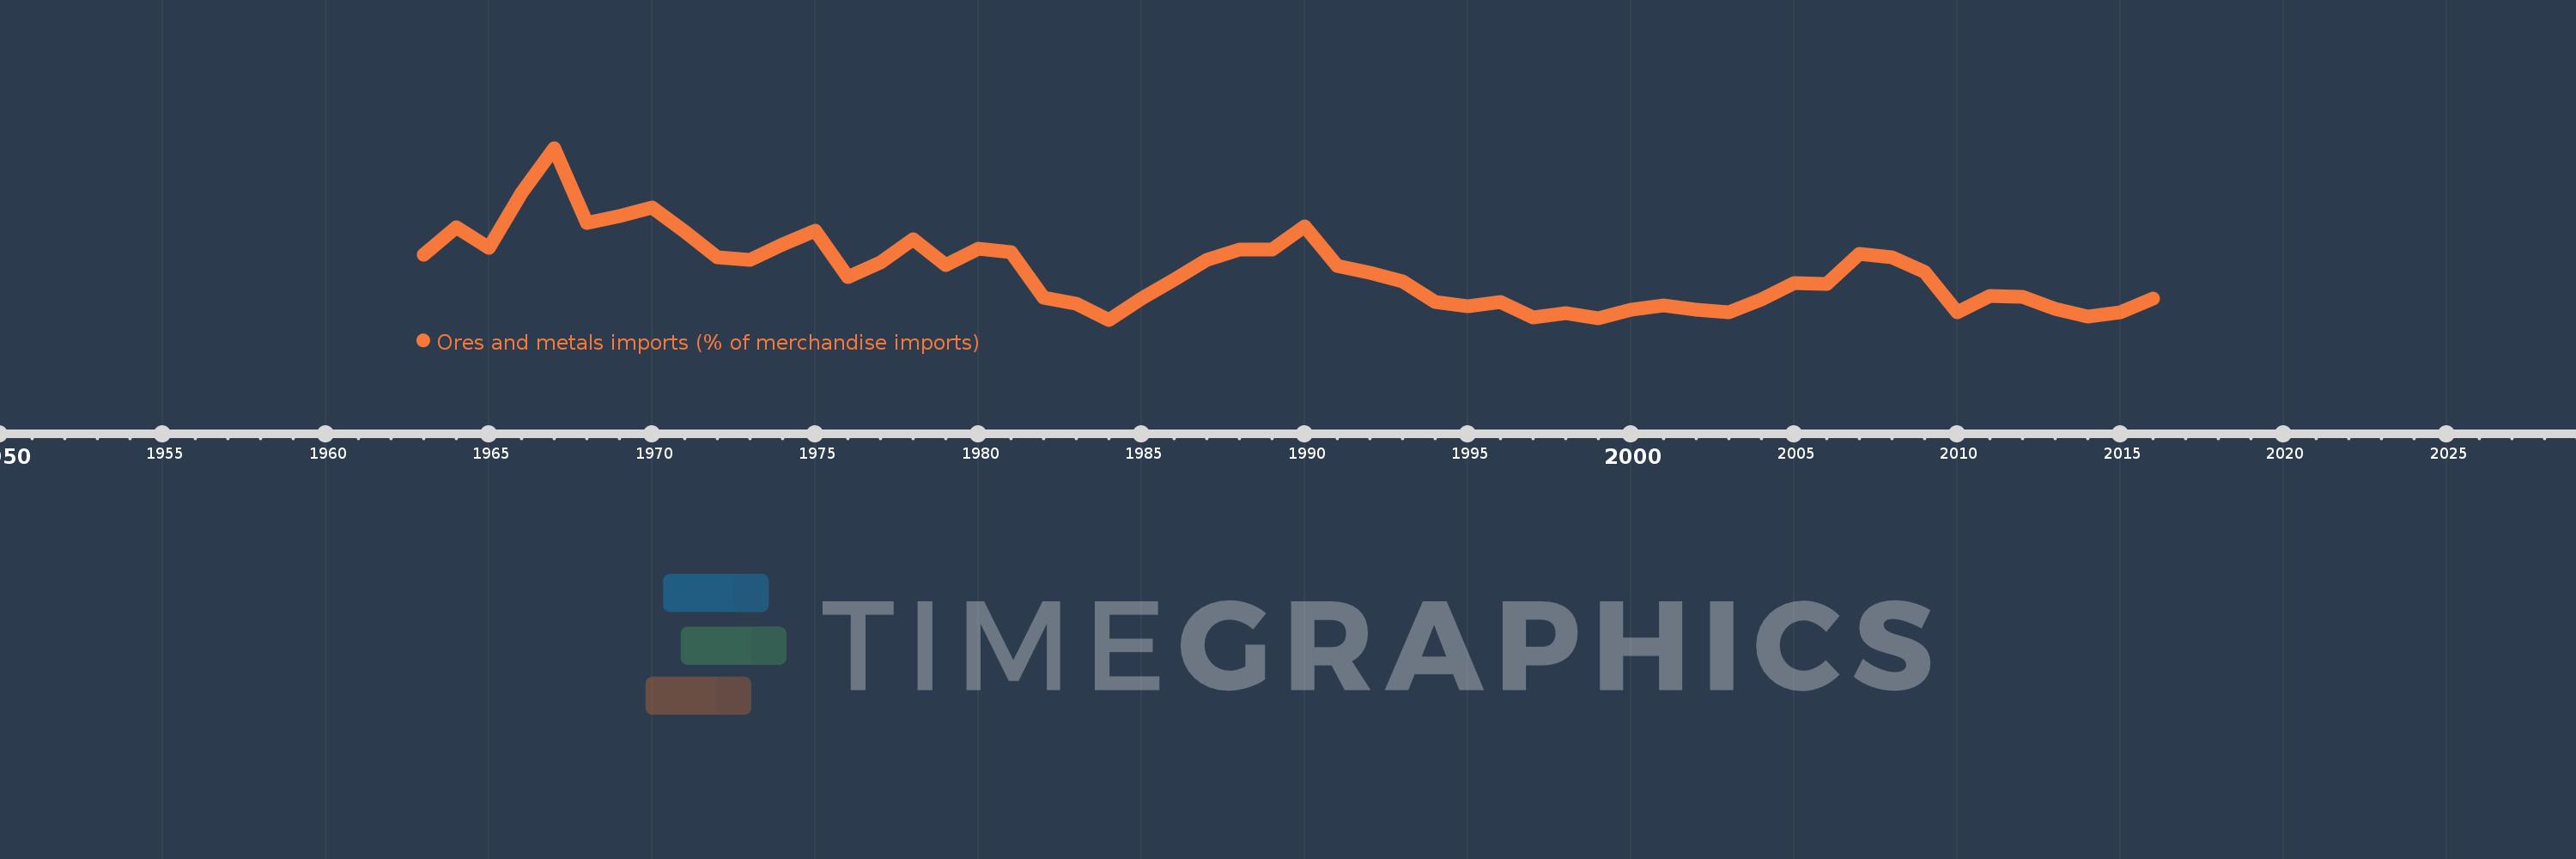
Ores and metals imports (% of merchandise imports)
2016,2015,2014,2013,2012,2011,2010,2009,2008,2007,2006,2005,2004,2003,2002,2001,2000,1999,1998,1997,1996,1995,1994,1993,1992,1991,1990,1989,1988,1987,1986,1985,1984,1983,1982,1981,1980,1979,1978,1977,1976,1975,1974,1973,1972,1971,1970,1969,1968,1967,1966,1965,1964,1963
This statistics in other country:
AfghanistanAlbaniaAlgeriaAndorraAngolaAntigua and BarbudaArab WorldArgentinaArmeniaArubaAustraliaAustriaAzerbaijanBahamas, TheBahrainBangladeshBarbadosBelarusBelgiumBelizeBeninBermudaBhutanBoliviaBosnia and HerzegovinaBotswanaBrazilBrunei DarussalamBulgariaBurkina FasoBurundiCabo VerdeCambodiaCameroonCanadaCaribbean small statesCayman IslandsCentral African RepublicCentral Europe and the BalticsChadChileChinaColombiaComorosCongo, Dem. Rep.Congo, Rep.Costa RicaCote d'IvoireCroatiaCubaCyprusCzech RepublicDenmarkDjiboutiDominicaDominican RepublicEarly-demographic dividendEast Asia & PacificEast Asia & Pacific (excluding high income)East Asia & Pacific (IDA & IBRD countries)EcuadorEgypt, Arab Rep.El SalvadorEquatorial GuineaEritreaEstoniaEthiopiaEuro areaEurope & Central AsiaEurope & Central Asia (excluding high income)Europe & Central Asia (IDA & IBRD countries)European UnionFaroe IslandsFijiFinlandFragile and conflict affected situationsFranceFrench PolynesiaGabonGambia, TheGeorgiaGermanyGhanaGreeceGreenlandGrenadaGuatemalaGuineaGuinea-BissauGuyanaHaitiHeavily indebted poor countries (HIPC)High incomeHondurasHong Kong SAR, ChinaHungaryIBRD onlyIcelandIDA & IBRD totalIDA blendIDA onlyIDA totalIndiaIndonesiaIran, Islamic Rep.IraqIrelandIsraelItalyJamaicaJapanJordanKazakhstanKenyaKiribatiKorea, Rep.KuwaitKyrgyz RepublicLao PDRLate-demographic dividendLatin America & Caribbean Latin America & Caribbean (excluding high income)Latin America & the Caribbean (IDA & IBRD countries)LatviaLeast developed countries: UN classificationLebanonLesothoLiberiaLibyaLithuaniaLow & middle incomeLow incomeLower middle incomeLuxembourgMacao SAR, ChinaMacedonia, FYRMadagascarMalawiMalaysiaMaldivesMaliMaltaMauritaniaMauritiusMexicoMiddle East & North AfricaMiddle East & North Africa (excluding high income)Middle East & North Africa (IDA & IBRD countries)Middle incomeMoldovaMongoliaMoroccoMozambiqueMyanmarNamibiaNepalNetherlandsNew CaledoniaNew ZealandNicaraguaNigerNigeriaNorth AmericaNorwayOECD membersOmanOther small statesPacific island small statesPakistanPalauPanamaPapua New GuineaParaguayPeruPhilippinesPolandPortugalPost-demographic dividendPre-demographic dividendQatarRomaniaRussian FederationRwandaSamoaSao Tome and PrincipeSaudi ArabiaSenegalSerbiaSeychellesSierra LeoneSingaporeSlovak RepublicSloveniaSmall statesSolomon IslandsSomaliaSouth AfricaSouth AsiaSouth Asia (IDA & IBRD)SpainSri LankaSt. Kitts and NevisSt. LuciaSt. Vincent and the GrenadinesSub-Saharan Africa Sub-Saharan Africa (excluding high income)Sub-Saharan Africa (IDA & IBRD countries)SudanSurinameSwazilandSwedenSwitzerlandSyrian Arab RepublicTajikistanTanzaniaThailandTimor-LesteTogoTongaTrinidad and TobagoTunisiaTurkeyTurkmenistanTurks and Caicos IslandsTuvaluUgandaUkraineUnited Arab EmiratesUnited KingdomUnited StatesUpper middle incomeUruguayVanuatuVenezuela, RBVietnamVirgin Islands (U.S.)WorldYemen, Rep.ZambiaZimbabwe Timeline:
This timeline shows a graph from 1963 to 2016 of Brazil. No data until 1962. Number of actual observations by date: 54.
Source name:
World Development Indicators
Source organization:
World Bank staff estimates from the Comtrade database maintained by the United Nations Statistics Division.
Categories, topics:
Energy & Mining, Private Sector, Trade
Last updated:
apr 23, 2017
Indicators value changes by year
At the date of observation
Value
Absolute change
Change from previous value
jan 1, 1963
5.015
+5.015
0.0%
jan 1, 1964
6.049
+1.034
20.62%
jan 1, 1965
5.294
-0.755
-12.48%
jan 1, 1966
7.357
+2.063
38.97%
jan 1, 1967
9.067
+1.71
23.25%
jan 1, 1968
6.238
-2.829
-31.2%
jan 1, 1969
6.491
+0.253
4.05%
jan 1, 1970
6.806
+0.315
4.86%
jan 1, 1971
5.918
-0.889
-13.06%
jan 1, 1972
4.923
-0.994
-16.8%
jan 1, 1973
4.824
-0.1
-2.02%
jan 1, 1974
5.41
+0.586
12.15%
jan 1, 1975
5.926
+0.516
9.54%
jan 1, 1976
4.177
-1.749
-29.52%
jan 1, 1977
4.739
+0.562
13.45%
jan 1, 1978
5.606
+0.867
18.29%
jan 1, 1979
4.647
-0.958
-17.09%
jan 1, 1980
5.248
+0.6
12.92%
jan 1, 1981
5.135
-0.113
-2.15%
jan 1, 1982
3.385
-1.75
-34.08%
jan 1, 1983
3.18
-0.205
-6.06%
jan 1, 1984
2.561
-0.618
-19.45%
jan 1, 1985
3.379
+0.817
31.92%
jan 1, 1986
4.09
+0.711
21.06%
jan 1, 1987
4.834
+0.743
18.17%
jan 1, 1988
5.211
+0.377
7.81%
jan 1, 1989
5.208
-0.003
-0.05%
jan 1, 1990
6.111
+0.902
17.32%
jan 1, 1991
4.6
-1.511
-24.73%
jan 1, 1992
4.331
-0.268
-5.83%
jan 1, 1993
4.01
-0.322
-7.42%
jan 1, 1994
3.231
-0.779
-19.42%
jan 1, 1995
3.059
-0.173
-5.34%
jan 1, 1996
3.228
+0.169
5.53%
jan 1, 1997
2.645
-0.583
-18.06%
jan 1, 1998
2.813
+0.168
6.35%
jan 1, 1999
2.621
-0.192
-6.81%
jan 1, 2000
2.946
+0.325
12.41%
jan 1, 2001
3.109
+0.162
5.51%
jan 1, 2002
2.953
-0.155
-5.0%
jan 1, 2003
2.851
-0.102
-3.45%
jan 1, 2004
3.332
+0.481
16.86%
jan 1, 2005
3.951
+0.619
18.58%
jan 1, 2006
3.926
-0.025
-0.64%
jan 1, 2007
5.07
+1.144
29.13%
jan 1, 2008
4.912
-0.157
-3.1%
jan 1, 2009
4.366
-0.546
-11.11%
jan 1, 2010
2.86
-1.506
-34.5%
jan 1, 2011
3.447
+0.587
20.51%
jan 1, 2012
3.44
-0.007
-0.2%
jan 1, 2013
2.958
-0.482
-14.0%
jan 1, 2014
2.688
-0.27
-9.14%
jan 1, 2015
2.843
+0.155
5.77%
jan 1, 2016
3.363
+0.52
18.28%
Ranking of countries by current statistics by years


Comments: