29
/
en
AIzaSyAYiBZKx7MnpbEhh9jyipgxe19OcubqV5w
April 1, 2024
185628
Madagascar
MDG
true
2
1
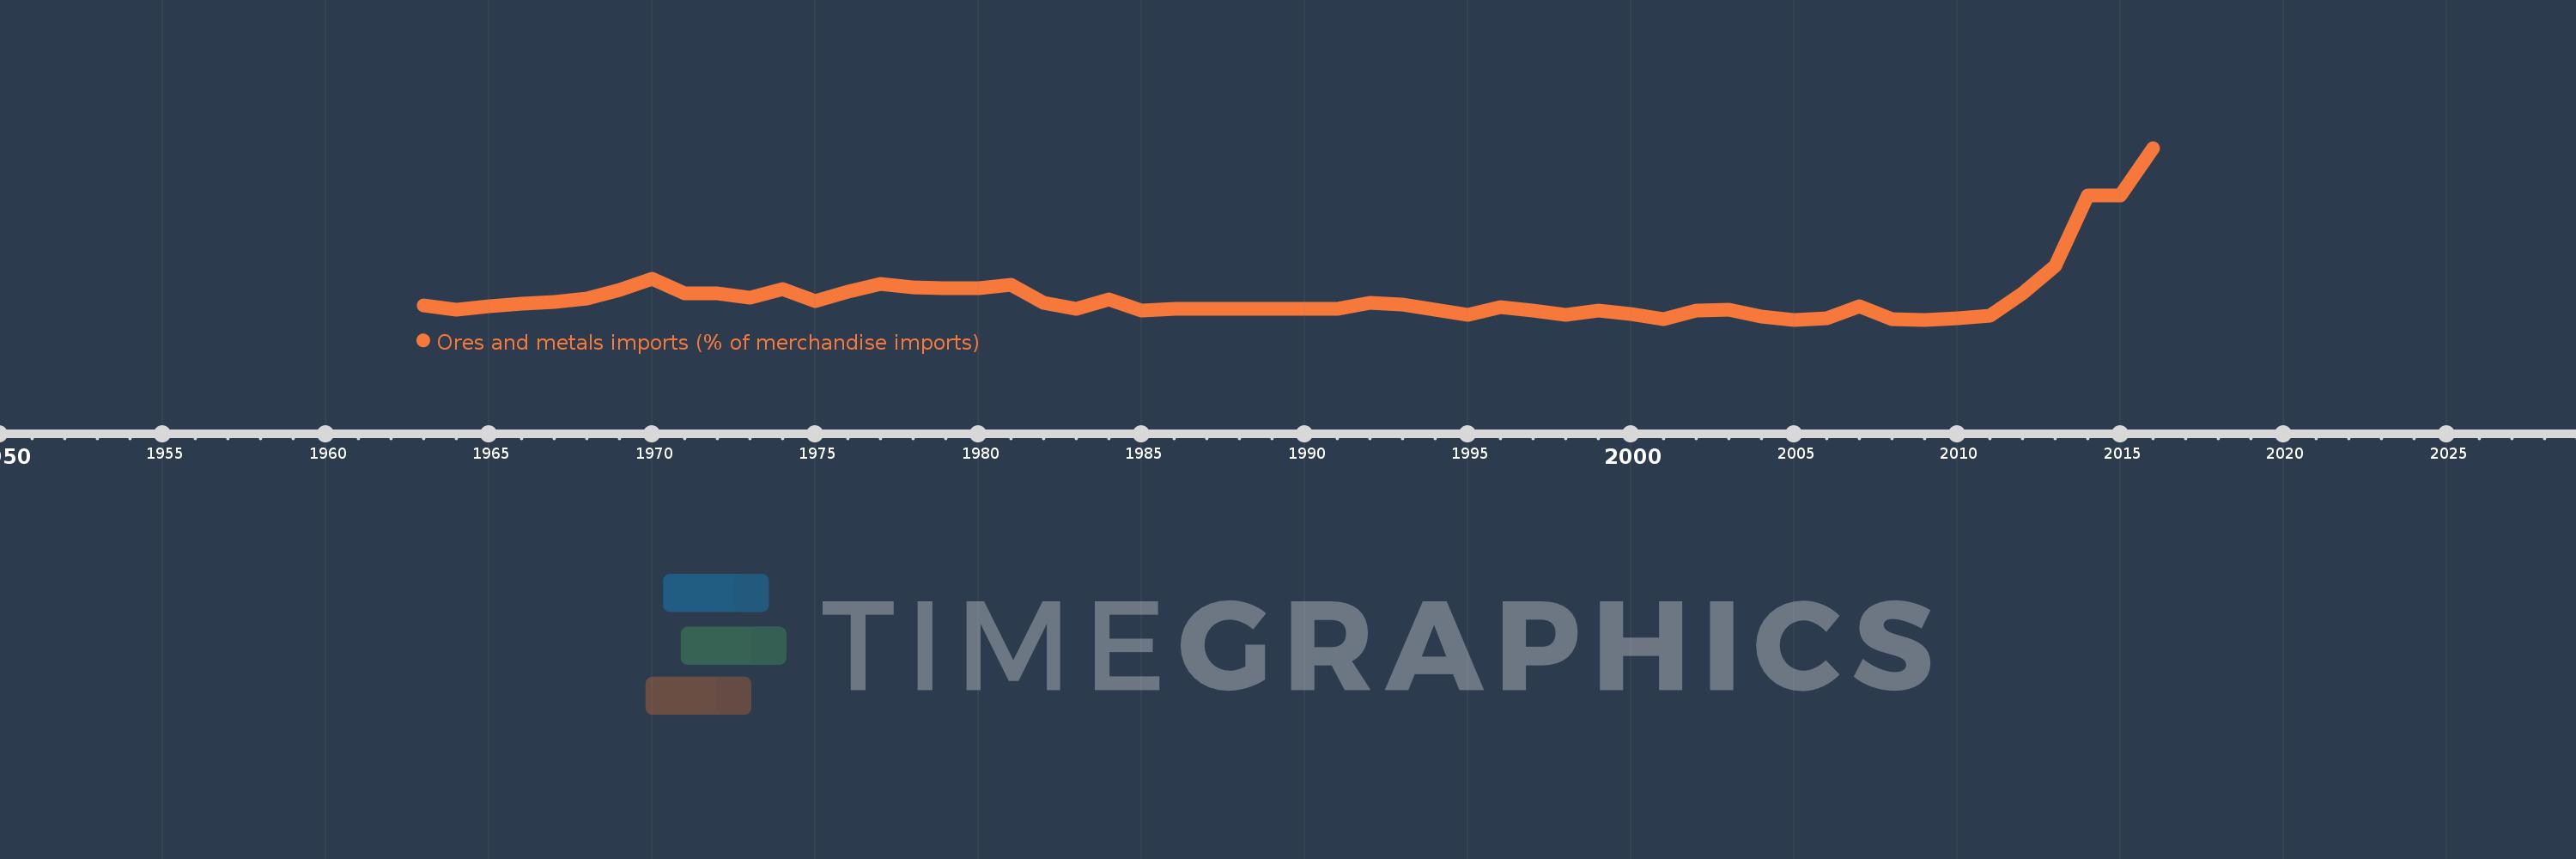
Ores and metals imports (% of merchandise imports)
2016,2015,2014,2013,2012,2011,2010,2009,2008,2007,2006,2005,2004,2003,2002,2001,2000,1999,1998,1997,1996,1995,1994,1993,1992,1991,1986,1985,1984,1983,1982,1981,1980,1979,1978,1977,1976,1975,1974,1973,1972,1971,1970,1969,1968,1967,1966,1965,1964,1963
This statistics in other country:
AfghanistanAlbaniaAlgeriaAndorraAngolaAntigua and BarbudaArab WorldArgentinaArmeniaArubaAustraliaAustriaAzerbaijanBahamas, TheBahrainBangladeshBarbadosBelarusBelgiumBelizeBeninBermudaBhutanBoliviaBosnia and HerzegovinaBotswanaBrazilBrunei DarussalamBulgariaBurkina FasoBurundiCabo VerdeCambodiaCameroonCanadaCaribbean small statesCayman IslandsCentral African RepublicCentral Europe and the BalticsChadChileChinaColombiaComorosCongo, Dem. Rep.Congo, Rep.Costa RicaCote d'IvoireCroatiaCubaCyprusCzech RepublicDenmarkDjiboutiDominicaDominican RepublicEarly-demographic dividendEast Asia & PacificEast Asia & Pacific (excluding high income)East Asia & Pacific (IDA & IBRD countries)EcuadorEgypt, Arab Rep.El SalvadorEquatorial GuineaEritreaEstoniaEthiopiaEuro areaEurope & Central AsiaEurope & Central Asia (excluding high income)Europe & Central Asia (IDA & IBRD countries)European UnionFaroe IslandsFijiFinlandFragile and conflict affected situationsFranceFrench PolynesiaGabonGambia, TheGeorgiaGermanyGhanaGreeceGreenlandGrenadaGuatemalaGuineaGuinea-BissauGuyanaHaitiHeavily indebted poor countries (HIPC)High incomeHondurasHong Kong SAR, ChinaHungaryIBRD onlyIcelandIDA & IBRD totalIDA blendIDA onlyIDA totalIndiaIndonesiaIran, Islamic Rep.IraqIrelandIsraelItalyJamaicaJapanJordanKazakhstanKenyaKiribatiKorea, Rep.KuwaitKyrgyz RepublicLao PDRLate-demographic dividendLatin America & Caribbean Latin America & Caribbean (excluding high income)Latin America & the Caribbean (IDA & IBRD countries)LatviaLeast developed countries: UN classificationLebanonLesothoLiberiaLibyaLithuaniaLow & middle incomeLow incomeLower middle incomeLuxembourgMacao SAR, ChinaMacedonia, FYRMadagascarMalawiMalaysiaMaldivesMaliMaltaMauritaniaMauritiusMexicoMiddle East & North AfricaMiddle East & North Africa (excluding high income)Middle East & North Africa (IDA & IBRD countries)Middle incomeMoldovaMongoliaMoroccoMozambiqueMyanmarNamibiaNepalNetherlandsNew CaledoniaNew ZealandNicaraguaNigerNigeriaNorth AmericaNorwayOECD membersOmanOther small statesPacific island small statesPakistanPalauPanamaPapua New GuineaParaguayPeruPhilippinesPolandPortugalPost-demographic dividendPre-demographic dividendQatarRomaniaRussian FederationRwandaSamoaSao Tome and PrincipeSaudi ArabiaSenegalSerbiaSeychellesSierra LeoneSingaporeSlovak RepublicSloveniaSmall statesSolomon IslandsSomaliaSouth AfricaSouth AsiaSouth Asia (IDA & IBRD)SpainSri LankaSt. Kitts and NevisSt. LuciaSt. Vincent and the GrenadinesSub-Saharan Africa Sub-Saharan Africa (excluding high income)Sub-Saharan Africa (IDA & IBRD countries)SudanSurinameSwazilandSwedenSwitzerlandSyrian Arab RepublicTajikistanTanzaniaThailandTimor-LesteTogoTongaTrinidad and TobagoTunisiaTurkeyTurkmenistanTurks and Caicos IslandsTuvaluUgandaUkraineUnited Arab EmiratesUnited KingdomUnited StatesUpper middle incomeUruguayVanuatuVenezuela, RBVietnamVirgin Islands (U.S.)WorldYemen, Rep.ZambiaZimbabwe Timeline:
This timeline shows a graph from 1963 to 2016 of Madagascar. No data until 1962. Number of actual observations by date: 50.
Source name:
World Development Indicators
Source organization:
World Bank staff estimates from the Comtrade database maintained by the United Nations Statistics Division.
Categories, topics:
Energy & Mining, Private Sector, Trade
Last updated:
apr 23, 2017
Indicators value changes by year
At the date of observation
Value
Absolute change
Change from previous value
jan 1, 1963
0.672
+0.672
0.0%
jan 1, 1964
0.567
-0.106
-15.72%
jan 1, 1965
0.652
+0.085
15.0%
jan 1, 1966
0.71
+0.058
8.9%
jan 1, 1967
0.765
+0.055
7.81%
jan 1, 1968
0.84
+0.075
9.8%
jan 1, 1969
1.056
+0.216
25.73%
jan 1, 1970
1.315
+0.258
24.47%
jan 1, 1971
0.974
-0.341
-25.95%
jan 1, 1972
0.97
-0.004
-0.4%
jan 1, 1973
0.852
-0.118
-12.18%
jan 1, 1974
1.076
+0.224
26.3%
jan 1, 1975
0.768
-0.308
-28.63%
jan 1, 1976
1.017
+0.249
32.47%
jan 1, 1977
1.198
+0.181
17.84%
jan 1, 1978
1.108
-0.09
-7.51%
jan 1, 1979
1.1
-0.008
-0.73%
jan 1, 1980
1.091
-0.01
-0.87%
jan 1, 1981
1.171
+0.08
7.32%
jan 1, 1982
0.737
-0.434
-37.04%
jan 1, 1983
0.58
-0.157
-21.34%
jan 1, 1984
0.815
+0.235
40.58%
jan 1, 1985
0.557
-0.258
-31.6%
jan 1, 1986
0.592
+0.034
6.12%
jan 1, 1991
0.59
-0.002
-0.28%
jan 1, 1992
0.743
+0.153
25.86%
jan 1, 1993
0.701
-0.042
-5.6%
jan 1, 1994
0.564
-0.137
-19.49%
jan 1, 1995
0.453
-0.111
-19.71%
jan 1, 1996
0.638
+0.184
40.7%
jan 1, 1997
0.54
-0.097
-15.23%
jan 1, 1998
0.448
-0.092
-17.1%
jan 1, 1999
0.549
+0.101
22.62%
jan 1, 2000
0.47
-0.079
-14.45%
jan 1, 2001
0.341
-0.129
-27.41%
jan 1, 2002
0.555
+0.214
62.6%
jan 1, 2003
0.563
+0.008
1.47%
jan 1, 2004
0.396
-0.167
-29.63%
jan 1, 2005
0.324
-0.072
-18.27%
jan 1, 2006
0.351
+0.027
8.35%
jan 1, 2007
0.661
+0.31
88.51%
jan 1, 2008
0.336
-0.325
-49.13%
jan 1, 2009
0.324
-0.013
-3.83%
jan 1, 2010
0.365
+0.041
12.72%
jan 1, 2011
0.412
+0.048
13.05%
jan 1, 2012
0.965
+0.553
134.06%
jan 1, 2013
1.643
+0.679
70.32%
jan 1, 2014
3.347
+1.703
103.63%
jan 1, 2015
3.351
+0.005
0.14%
jan 1, 2016
4.499
+1.147
34.24%
Ranking of countries by current statistics by years


Comments: