29
/
en
AIzaSyAYiBZKx7MnpbEhh9jyipgxe19OcubqV5w
April 1, 2024
286324
Zambia
ZMB
true
2
1
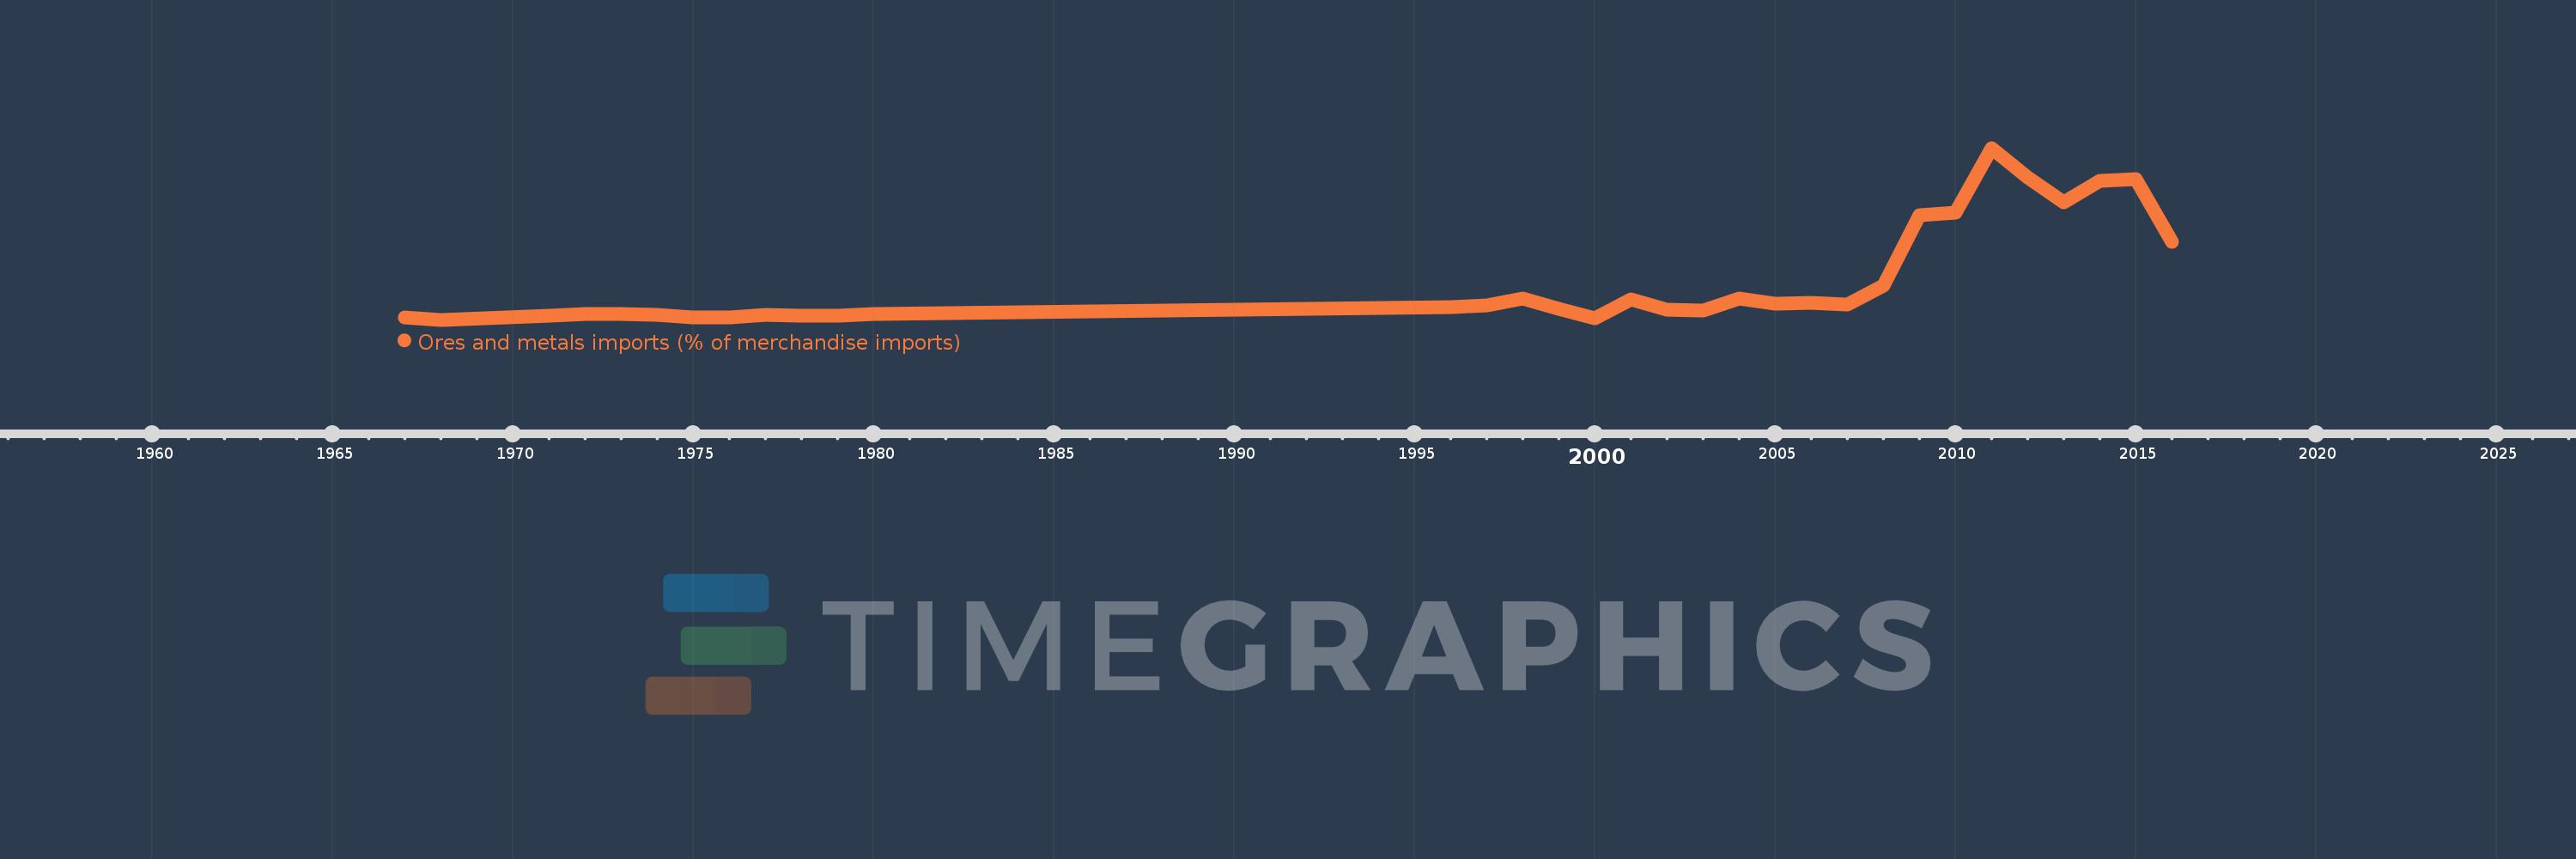
Ores and metals imports (% of merchandise imports)
2016,2015,2014,2013,2012,2011,2010,2009,2008,2007,2006,2005,2004,2003,2002,2001,2000,1999,1998,1997,1996,1980,1979,1978,1977,1976,1975,1974,1973,1972,1971,1968,1967
This statistics in other country:
AfghanistanAlbaniaAlgeriaAndorraAngolaAntigua and BarbudaArab WorldArgentinaArmeniaArubaAustraliaAustriaAzerbaijanBahamas, TheBahrainBangladeshBarbadosBelarusBelgiumBelizeBeninBermudaBhutanBoliviaBosnia and HerzegovinaBotswanaBrazilBrunei DarussalamBulgariaBurkina FasoBurundiCabo VerdeCambodiaCameroonCanadaCaribbean small statesCayman IslandsCentral African RepublicCentral Europe and the BalticsChadChileChinaColombiaComorosCongo, Dem. Rep.Congo, Rep.Costa RicaCote d'IvoireCroatiaCubaCyprusCzech RepublicDenmarkDjiboutiDominicaDominican RepublicEarly-demographic dividendEast Asia & PacificEast Asia & Pacific (excluding high income)East Asia & Pacific (IDA & IBRD countries)EcuadorEgypt, Arab Rep.El SalvadorEquatorial GuineaEritreaEstoniaEthiopiaEuro areaEurope & Central AsiaEurope & Central Asia (excluding high income)Europe & Central Asia (IDA & IBRD countries)European UnionFaroe IslandsFijiFinlandFragile and conflict affected situationsFranceFrench PolynesiaGabonGambia, TheGeorgiaGermanyGhanaGreeceGreenlandGrenadaGuatemalaGuineaGuinea-BissauGuyanaHaitiHeavily indebted poor countries (HIPC)High incomeHondurasHong Kong SAR, ChinaHungaryIBRD onlyIcelandIDA & IBRD totalIDA blendIDA onlyIDA totalIndiaIndonesiaIran, Islamic Rep.IraqIrelandIsraelItalyJamaicaJapanJordanKazakhstanKenyaKiribatiKorea, Rep.KuwaitKyrgyz RepublicLao PDRLate-demographic dividendLatin America & Caribbean Latin America & Caribbean (excluding high income)Latin America & the Caribbean (IDA & IBRD countries)LatviaLeast developed countries: UN classificationLebanonLesothoLiberiaLibyaLithuaniaLow & middle incomeLow incomeLower middle incomeLuxembourgMacao SAR, ChinaMacedonia, FYRMadagascarMalawiMalaysiaMaldivesMaliMaltaMauritaniaMauritiusMexicoMiddle East & North AfricaMiddle East & North Africa (excluding high income)Middle East & North Africa (IDA & IBRD countries)Middle incomeMoldovaMongoliaMoroccoMozambiqueMyanmarNamibiaNepalNetherlandsNew CaledoniaNew ZealandNicaraguaNigerNigeriaNorth AmericaNorwayOECD membersOmanOther small statesPacific island small statesPakistanPalauPanamaPapua New GuineaParaguayPeruPhilippinesPolandPortugalPost-demographic dividendPre-demographic dividendQatarRomaniaRussian FederationRwandaSamoaSao Tome and PrincipeSaudi ArabiaSenegalSerbiaSeychellesSierra LeoneSingaporeSlovak RepublicSloveniaSmall statesSolomon IslandsSomaliaSouth AfricaSouth AsiaSouth Asia (IDA & IBRD)SpainSri LankaSt. Kitts and NevisSt. LuciaSt. Vincent and the GrenadinesSub-Saharan Africa Sub-Saharan Africa (excluding high income)Sub-Saharan Africa (IDA & IBRD countries)SudanSurinameSwazilandSwedenSwitzerlandSyrian Arab RepublicTajikistanTanzaniaThailandTimor-LesteTogoTongaTrinidad and TobagoTunisiaTurkeyTurkmenistanTurks and Caicos IslandsTuvaluUgandaUkraineUnited Arab EmiratesUnited KingdomUnited StatesUpper middle incomeUruguayVanuatuVenezuela, RBVietnamVirgin Islands (U.S.)WorldYemen, Rep.ZambiaZimbabwe Timeline:
This timeline shows a graph from 1967 to 2016 of Zambia. No data until 1966. Number of actual observations by date: 33.
Source name:
World Development Indicators
Source organization:
World Bank staff estimates from the Comtrade database maintained by the United Nations Statistics Division.
Categories, topics:
Energy & Mining, Private Sector, Trade
Last updated:
apr 23, 2017
Indicators value changes by year
Maximum:
21.029
jan 1, 2011
At the date of observation
Value
Absolute change
Change from previous value
jan 1, 1967
0.938
+0.938
0.0%
jan 1, 1968
0.669
-0.268
-28.62%
jan 1, 1971
1.192
+0.523
78.16%
jan 1, 1972
1.329
+0.137
11.47%
jan 1, 1973
1.358
+0.029
2.2%
jan 1, 1974
1.229
-0.129
-9.51%
jan 1, 1975
0.982
-0.247
-20.11%
jan 1, 1976
0.913
-0.069
-7.0%
jan 1, 1977
1.2
+0.287
31.42%
jan 1, 1978
1.101
-0.1
-8.29%
jan 1, 1979
1.12
+0.02
1.8%
jan 1, 1980
1.348
+0.228
20.31%
jan 1, 1996
2.153
+0.805
59.74%
jan 1, 1997
2.413
+0.26
12.07%
jan 1, 1998
3.201
+0.788
32.65%
jan 1, 1999
1.993
-1.208
-37.75%
jan 1, 2000
0.833
-1.16
-58.2%
jan 1, 2001
3.129
+2.296
275.72%
jan 1, 2002
1.811
-1.318
-42.13%
jan 1, 2003
1.804
-0.006
-0.36%
jan 1, 2004
3.134
+1.33
73.7%
jan 1, 2005
2.591
-0.544
-17.35%
jan 1, 2006
2.63
+0.04
1.54%
jan 1, 2007
2.479
-0.152
-5.78%
jan 1, 2008
4.712
+2.233
90.11%
jan 1, 2009
13.046
+8.334
176.87%
jan 1, 2010
13.338
+0.292
2.24%
jan 1, 2011
21.029
+7.691
57.67%
jan 1, 2012
17.562
-3.467
-16.49%
jan 1, 2013
14.578
-2.984
-16.99%
jan 1, 2014
17.158
+2.579
17.69%
jan 1, 2015
17.314
+0.157
0.91%
jan 1, 2016
9.92
-7.394
-42.71%
Ranking of countries by current statistics by years


Comments: