29
/
en
AIzaSyAYiBZKx7MnpbEhh9jyipgxe19OcubqV5w
April 1, 2024
246044
South Africa
ZAF
true
2
1
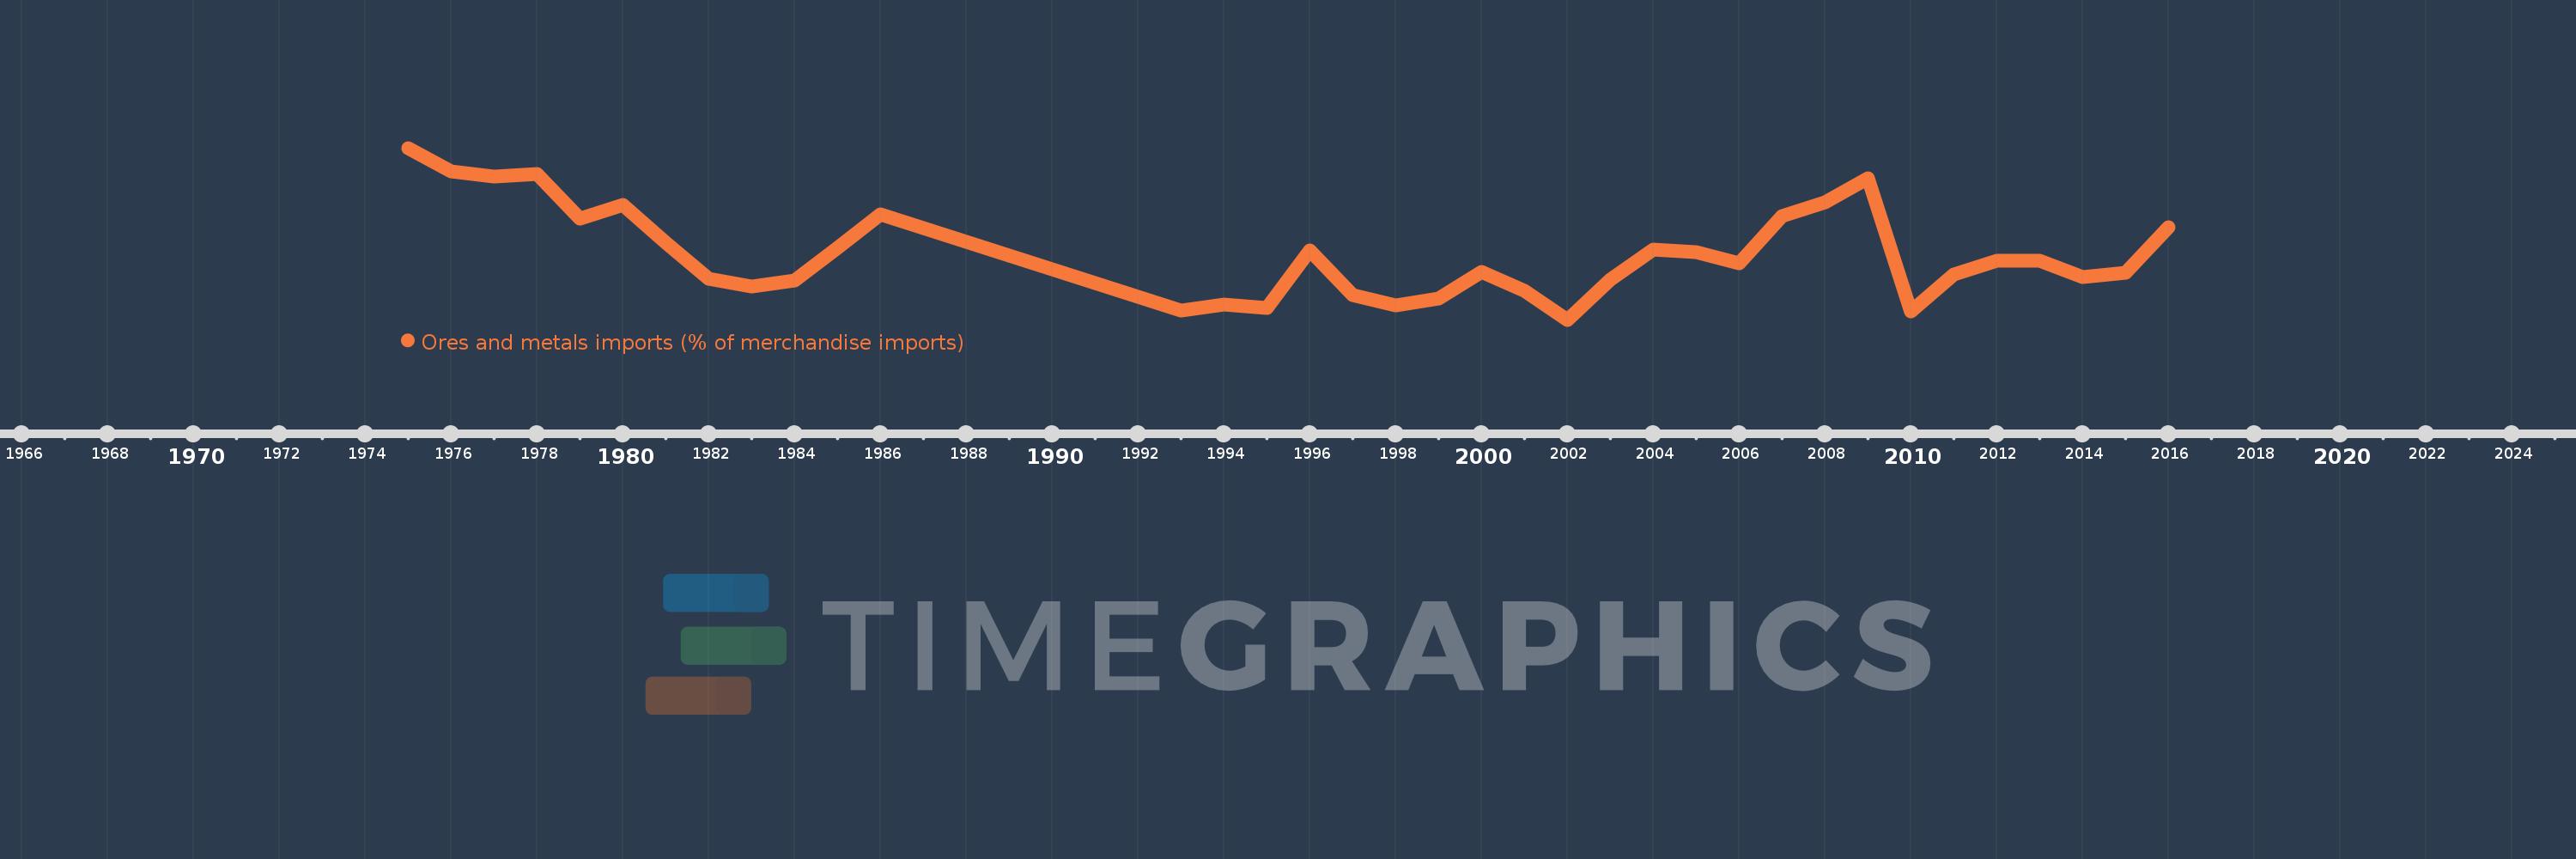
Ores and metals imports (% of merchandise imports)
2016,2015,2014,2013,2012,2011,2010,2009,2008,2007,2006,2005,2004,2003,2002,2001,2000,1999,1998,1997,1996,1995,1994,1993,1986,1985,1984,1983,1982,1981,1980,1979,1978,1977,1976,1975
This statistics in other country:
AfghanistanAlbaniaAlgeriaAndorraAngolaAntigua and BarbudaArab WorldArgentinaArmeniaArubaAustraliaAustriaAzerbaijanBahamas, TheBahrainBangladeshBarbadosBelarusBelgiumBelizeBeninBermudaBhutanBoliviaBosnia and HerzegovinaBotswanaBrazilBrunei DarussalamBulgariaBurkina FasoBurundiCabo VerdeCambodiaCameroonCanadaCaribbean small statesCayman IslandsCentral African RepublicCentral Europe and the BalticsChadChileChinaColombiaComorosCongo, Dem. Rep.Congo, Rep.Costa RicaCote d'IvoireCroatiaCubaCyprusCzech RepublicDenmarkDjiboutiDominicaDominican RepublicEarly-demographic dividendEast Asia & PacificEast Asia & Pacific (excluding high income)East Asia & Pacific (IDA & IBRD countries)EcuadorEgypt, Arab Rep.El SalvadorEquatorial GuineaEritreaEstoniaEthiopiaEuro areaEurope & Central AsiaEurope & Central Asia (excluding high income)Europe & Central Asia (IDA & IBRD countries)European UnionFaroe IslandsFijiFinlandFragile and conflict affected situationsFranceFrench PolynesiaGabonGambia, TheGeorgiaGermanyGhanaGreeceGreenlandGrenadaGuatemalaGuineaGuinea-BissauGuyanaHaitiHeavily indebted poor countries (HIPC)High incomeHondurasHong Kong SAR, ChinaHungaryIBRD onlyIcelandIDA & IBRD totalIDA blendIDA onlyIDA totalIndiaIndonesiaIran, Islamic Rep.IraqIrelandIsraelItalyJamaicaJapanJordanKazakhstanKenyaKiribatiKorea, Rep.KuwaitKyrgyz RepublicLao PDRLate-demographic dividendLatin America & Caribbean Latin America & Caribbean (excluding high income)Latin America & the Caribbean (IDA & IBRD countries)LatviaLeast developed countries: UN classificationLebanonLesothoLiberiaLibyaLithuaniaLow & middle incomeLow incomeLower middle incomeLuxembourgMacao SAR, ChinaMacedonia, FYRMadagascarMalawiMalaysiaMaldivesMaliMaltaMauritaniaMauritiusMexicoMiddle East & North AfricaMiddle East & North Africa (excluding high income)Middle East & North Africa (IDA & IBRD countries)Middle incomeMoldovaMongoliaMoroccoMozambiqueMyanmarNamibiaNepalNetherlandsNew CaledoniaNew ZealandNicaraguaNigerNigeriaNorth AmericaNorwayOECD membersOmanOther small statesPacific island small statesPakistanPalauPanamaPapua New GuineaParaguayPeruPhilippinesPolandPortugalPost-demographic dividendPre-demographic dividendQatarRomaniaRussian FederationRwandaSamoaSao Tome and PrincipeSaudi ArabiaSenegalSerbiaSeychellesSierra LeoneSingaporeSlovak RepublicSloveniaSmall statesSolomon IslandsSomaliaSouth AfricaSouth AsiaSouth Asia (IDA & IBRD)SpainSri LankaSt. Kitts and NevisSt. LuciaSt. Vincent and the GrenadinesSub-Saharan Africa Sub-Saharan Africa (excluding high income)Sub-Saharan Africa (IDA & IBRD countries)SudanSurinameSwazilandSwedenSwitzerlandSyrian Arab RepublicTajikistanTanzaniaThailandTimor-LesteTogoTongaTrinidad and TobagoTunisiaTurkeyTurkmenistanTurks and Caicos IslandsTuvaluUgandaUkraineUnited Arab EmiratesUnited KingdomUnited StatesUpper middle incomeUruguayVanuatuVenezuela, RBVietnamVirgin Islands (U.S.)WorldYemen, Rep.ZambiaZimbabwe Timeline:
This timeline shows a graph from 1975 to 2016 of South Africa. No data until 1974. Number of actual observations by date: 36.
Source name:
World Development Indicators
Source organization:
World Bank staff estimates from the Comtrade database maintained by the United Nations Statistics Division.
Categories, topics:
Energy & Mining, Private Sector, Trade
Last updated:
apr 23, 2017
Indicators value changes by year
At the date of observation
Value
Absolute change
Change from previous value
jan 1, 1975
3.104
+3.104
0.0%
jan 1, 1976
2.843
-0.261
-8.42%
jan 1, 1977
2.786
-0.057
-2.01%
jan 1, 1978
2.819
+0.033
1.19%
jan 1, 1979
2.327
-0.492
-17.44%
jan 1, 1980
2.484
+0.157
6.75%
jan 1, 1981
2.067
-0.417
-16.79%
jan 1, 1982
1.673
-0.395
-19.1%
jan 1, 1983
1.587
-0.085
-5.09%
jan 1, 1984
1.651
+0.064
4.03%
jan 1, 1985
2.013
+0.361
21.88%
jan 1, 1986
2.378
+0.365
18.14%
jan 1, 1993
1.327
-1.051
-44.18%
jan 1, 1994
1.392
+0.065
4.88%
jan 1, 1995
1.353
-0.039
-2.77%
jan 1, 1996
1.982
+0.628
46.44%
jan 1, 1997
1.493
-0.489
-24.68%
jan 1, 1998
1.381
-0.112
-7.47%
jan 1, 1999
1.452
+0.071
5.16%
jan 1, 2000
1.742
+0.29
19.95%
jan 1, 2001
1.537
-0.205
-11.79%
jan 1, 2002
1.222
-0.315
-20.49%
jan 1, 2003
1.657
+0.436
35.66%
jan 1, 2004
1.993
+0.335
20.22%
jan 1, 2005
1.96
-0.033
-1.66%
jan 1, 2006
1.842
-0.118
-6.0%
jan 1, 2007
2.355
+0.513
27.83%
jan 1, 2008
2.51
+0.155
6.59%
jan 1, 2009
2.775
+0.266
10.58%
jan 1, 2010
1.312
-1.463
-52.72%
jan 1, 2011
1.716
+0.404
30.76%
jan 1, 2012
1.873
+0.157
9.15%
jan 1, 2013
1.867
-0.005
-0.29%
jan 1, 2014
1.692
-0.175
-9.37%
jan 1, 2015
1.74
+0.047
2.79%
jan 1, 2016
2.239
+0.5
28.72%
Ranking of countries by current statistics by years


Comments: