29
/
en
AIzaSyAYiBZKx7MnpbEhh9jyipgxe19OcubqV5w
April 1, 2024
117274
Cyprus
CYP
true
2
1
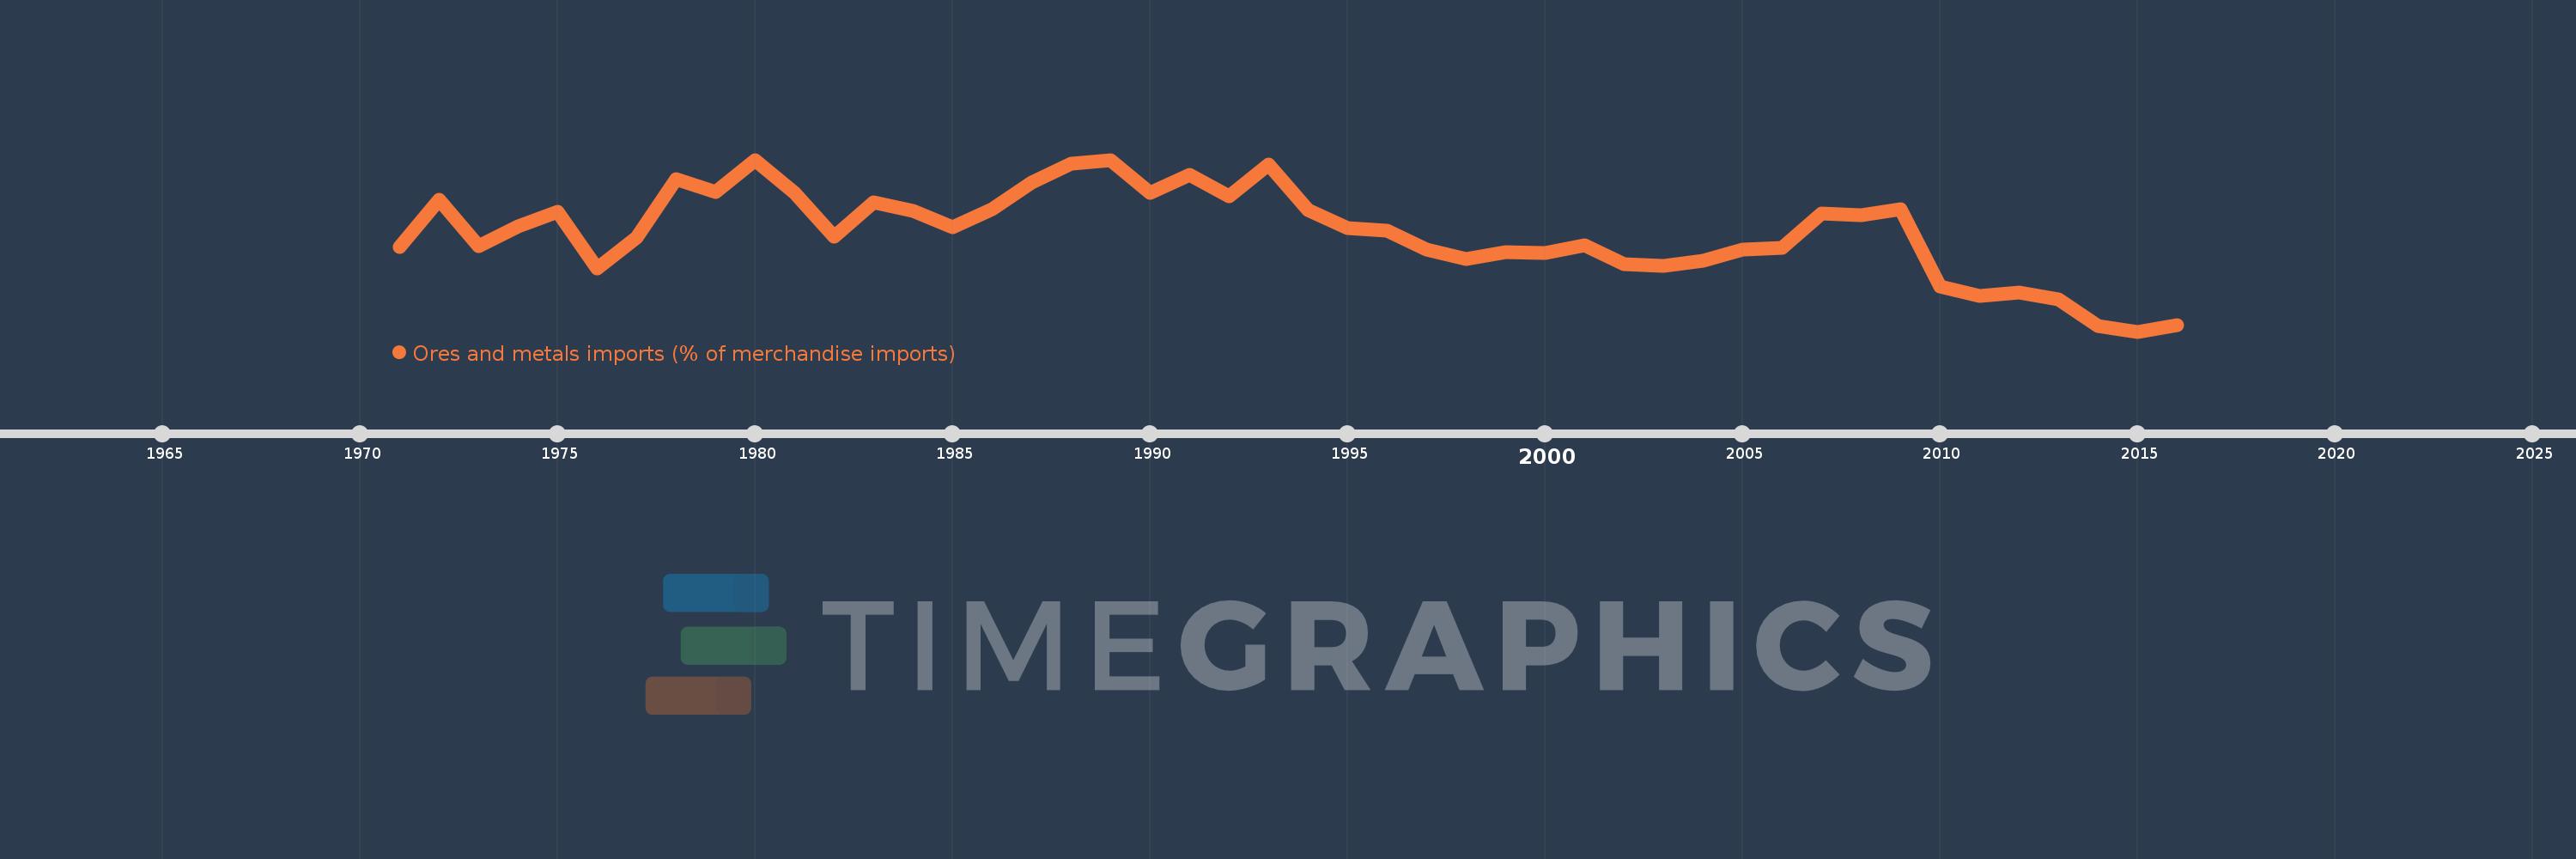
Ores and metals imports (% of merchandise imports)
2016,2015,2014,2013,2012,2011,2010,2009,2008,2007,2006,2005,2004,2003,2002,2001,2000,1999,1998,1997,1996,1995,1994,1993,1992,1991,1990,1989,1988,1987,1986,1985,1984,1983,1982,1981,1980,1979,1978,1977,1976,1975,1974,1973,1972,1971
This statistics in other country:
AfghanistanAlbaniaAlgeriaAndorraAngolaAntigua and BarbudaArab WorldArgentinaArmeniaArubaAustraliaAustriaAzerbaijanBahamas, TheBahrainBangladeshBarbadosBelarusBelgiumBelizeBeninBermudaBhutanBoliviaBosnia and HerzegovinaBotswanaBrazilBrunei DarussalamBulgariaBurkina FasoBurundiCabo VerdeCambodiaCameroonCanadaCaribbean small statesCayman IslandsCentral African RepublicCentral Europe and the BalticsChadChileChinaColombiaComorosCongo, Dem. Rep.Congo, Rep.Costa RicaCote d'IvoireCroatiaCubaCyprusCzech RepublicDenmarkDjiboutiDominicaDominican RepublicEarly-demographic dividendEast Asia & PacificEast Asia & Pacific (excluding high income)East Asia & Pacific (IDA & IBRD countries)EcuadorEgypt, Arab Rep.El SalvadorEquatorial GuineaEritreaEstoniaEthiopiaEuro areaEurope & Central AsiaEurope & Central Asia (excluding high income)Europe & Central Asia (IDA & IBRD countries)European UnionFaroe IslandsFijiFinlandFragile and conflict affected situationsFranceFrench PolynesiaGabonGambia, TheGeorgiaGermanyGhanaGreeceGreenlandGrenadaGuatemalaGuineaGuinea-BissauGuyanaHaitiHeavily indebted poor countries (HIPC)High incomeHondurasHong Kong SAR, ChinaHungaryIBRD onlyIcelandIDA & IBRD totalIDA blendIDA onlyIDA totalIndiaIndonesiaIran, Islamic Rep.IraqIrelandIsraelItalyJamaicaJapanJordanKazakhstanKenyaKiribatiKorea, Rep.KuwaitKyrgyz RepublicLao PDRLate-demographic dividendLatin America & Caribbean Latin America & Caribbean (excluding high income)Latin America & the Caribbean (IDA & IBRD countries)LatviaLeast developed countries: UN classificationLebanonLesothoLiberiaLibyaLithuaniaLow & middle incomeLow incomeLower middle incomeLuxembourgMacao SAR, ChinaMacedonia, FYRMadagascarMalawiMalaysiaMaldivesMaliMaltaMauritaniaMauritiusMexicoMiddle East & North AfricaMiddle East & North Africa (excluding high income)Middle East & North Africa (IDA & IBRD countries)Middle incomeMoldovaMongoliaMoroccoMozambiqueMyanmarNamibiaNepalNetherlandsNew CaledoniaNew ZealandNicaraguaNigerNigeriaNorth AmericaNorwayOECD membersOmanOther small statesPacific island small statesPakistanPalauPanamaPapua New GuineaParaguayPeruPhilippinesPolandPortugalPost-demographic dividendPre-demographic dividendQatarRomaniaRussian FederationRwandaSamoaSao Tome and PrincipeSaudi ArabiaSenegalSerbiaSeychellesSierra LeoneSingaporeSlovak RepublicSloveniaSmall statesSolomon IslandsSomaliaSouth AfricaSouth AsiaSouth Asia (IDA & IBRD)SpainSri LankaSt. Kitts and NevisSt. LuciaSt. Vincent and the GrenadinesSub-Saharan Africa Sub-Saharan Africa (excluding high income)Sub-Saharan Africa (IDA & IBRD countries)SudanSurinameSwazilandSwedenSwitzerlandSyrian Arab RepublicTajikistanTanzaniaThailandTimor-LesteTogoTongaTrinidad and TobagoTunisiaTurkeyTurkmenistanTurks and Caicos IslandsTuvaluUgandaUkraineUnited Arab EmiratesUnited KingdomUnited StatesUpper middle incomeUruguayVanuatuVenezuela, RBVietnamVirgin Islands (U.S.)WorldYemen, Rep.ZambiaZimbabwe Timeline:
This timeline shows a graph from 1971 to 2016 of Cyprus. No data until 1970. Number of actual observations by date: 46.
Source name:
World Development Indicators
Source organization:
World Bank staff estimates from the Comtrade database maintained by the United Nations Statistics Division.
Categories, topics:
Energy & Mining, Private Sector, Trade
Last updated:
apr 23, 2017
Indicators value changes by year
At the date of observation
Value
Absolute change
Change from previous value
jan 1, 1971
1.15
+1.15
0.0%
jan 1, 1972
1.467
+0.317
27.55%
jan 1, 1973
1.157
-0.31
-21.12%
jan 1, 1974
1.288
+0.13
11.24%
jan 1, 1975
1.39
+0.103
7.97%
jan 1, 1976
1.006
-0.384
-27.63%
jan 1, 1977
1.214
+0.208
20.65%
jan 1, 1978
1.607
+0.393
32.4%
jan 1, 1979
1.522
-0.085
-5.28%
jan 1, 1980
1.736
+0.214
14.05%
jan 1, 1981
1.516
-0.22
-12.66%
jan 1, 1982
1.221
-0.295
-19.49%
jan 1, 1983
1.452
+0.231
18.95%
jan 1, 1984
1.393
-0.059
-4.05%
jan 1, 1985
1.284
-0.109
-7.84%
jan 1, 1986
1.405
+0.121
9.42%
jan 1, 1987
1.583
+0.177
12.62%
jan 1, 1988
1.711
+0.129
8.12%
jan 1, 1989
1.738
+0.027
1.59%
jan 1, 1990
1.516
-0.222
-12.76%
jan 1, 1991
1.638
+0.121
8.01%
jan 1, 1992
1.494
-0.143
-8.76%
jan 1, 1993
1.708
+0.213
14.26%
jan 1, 1994
1.401
-0.307
-17.98%
jan 1, 1995
1.277
-0.123
-8.79%
jan 1, 1996
1.258
-0.019
-1.49%
jan 1, 1997
1.134
-0.124
-9.87%
jan 1, 1998
1.07
-0.064
-5.67%
jan 1, 1999
1.113
+0.043
4.06%
jan 1, 2000
1.111
-0.002
-0.21%
jan 1, 2001
1.164
+0.053
4.77%
jan 1, 2002
1.034
-0.13
-11.16%
jan 1, 2003
1.025
-0.009
-0.89%
jan 1, 2004
1.06
+0.035
3.39%
jan 1, 2005
1.131
+0.071
6.69%
jan 1, 2006
1.142
+0.011
1.01%
jan 1, 2007
1.376
+0.235
20.54%
jan 1, 2008
1.365
-0.012
-0.86%
jan 1, 2009
1.404
+0.039
2.87%
jan 1, 2010
0.886
-0.517
-36.86%
jan 1, 2011
0.822
-0.064
-7.24%
jan 1, 2012
0.841
+0.019
2.31%
jan 1, 2013
0.8
-0.041
-4.84%
jan 1, 2014
0.618
-0.182
-22.8%
jan 1, 2015
0.58
-0.038
-6.19%
jan 1, 2016
0.626
+0.046
7.97%
Ranking of countries by current statistics by years


Comments: