29
/
en
AIzaSyAYiBZKx7MnpbEhh9jyipgxe19OcubqV5w
April 1, 2024
114023
Cote d'Ivoire
CIV
true
2
1
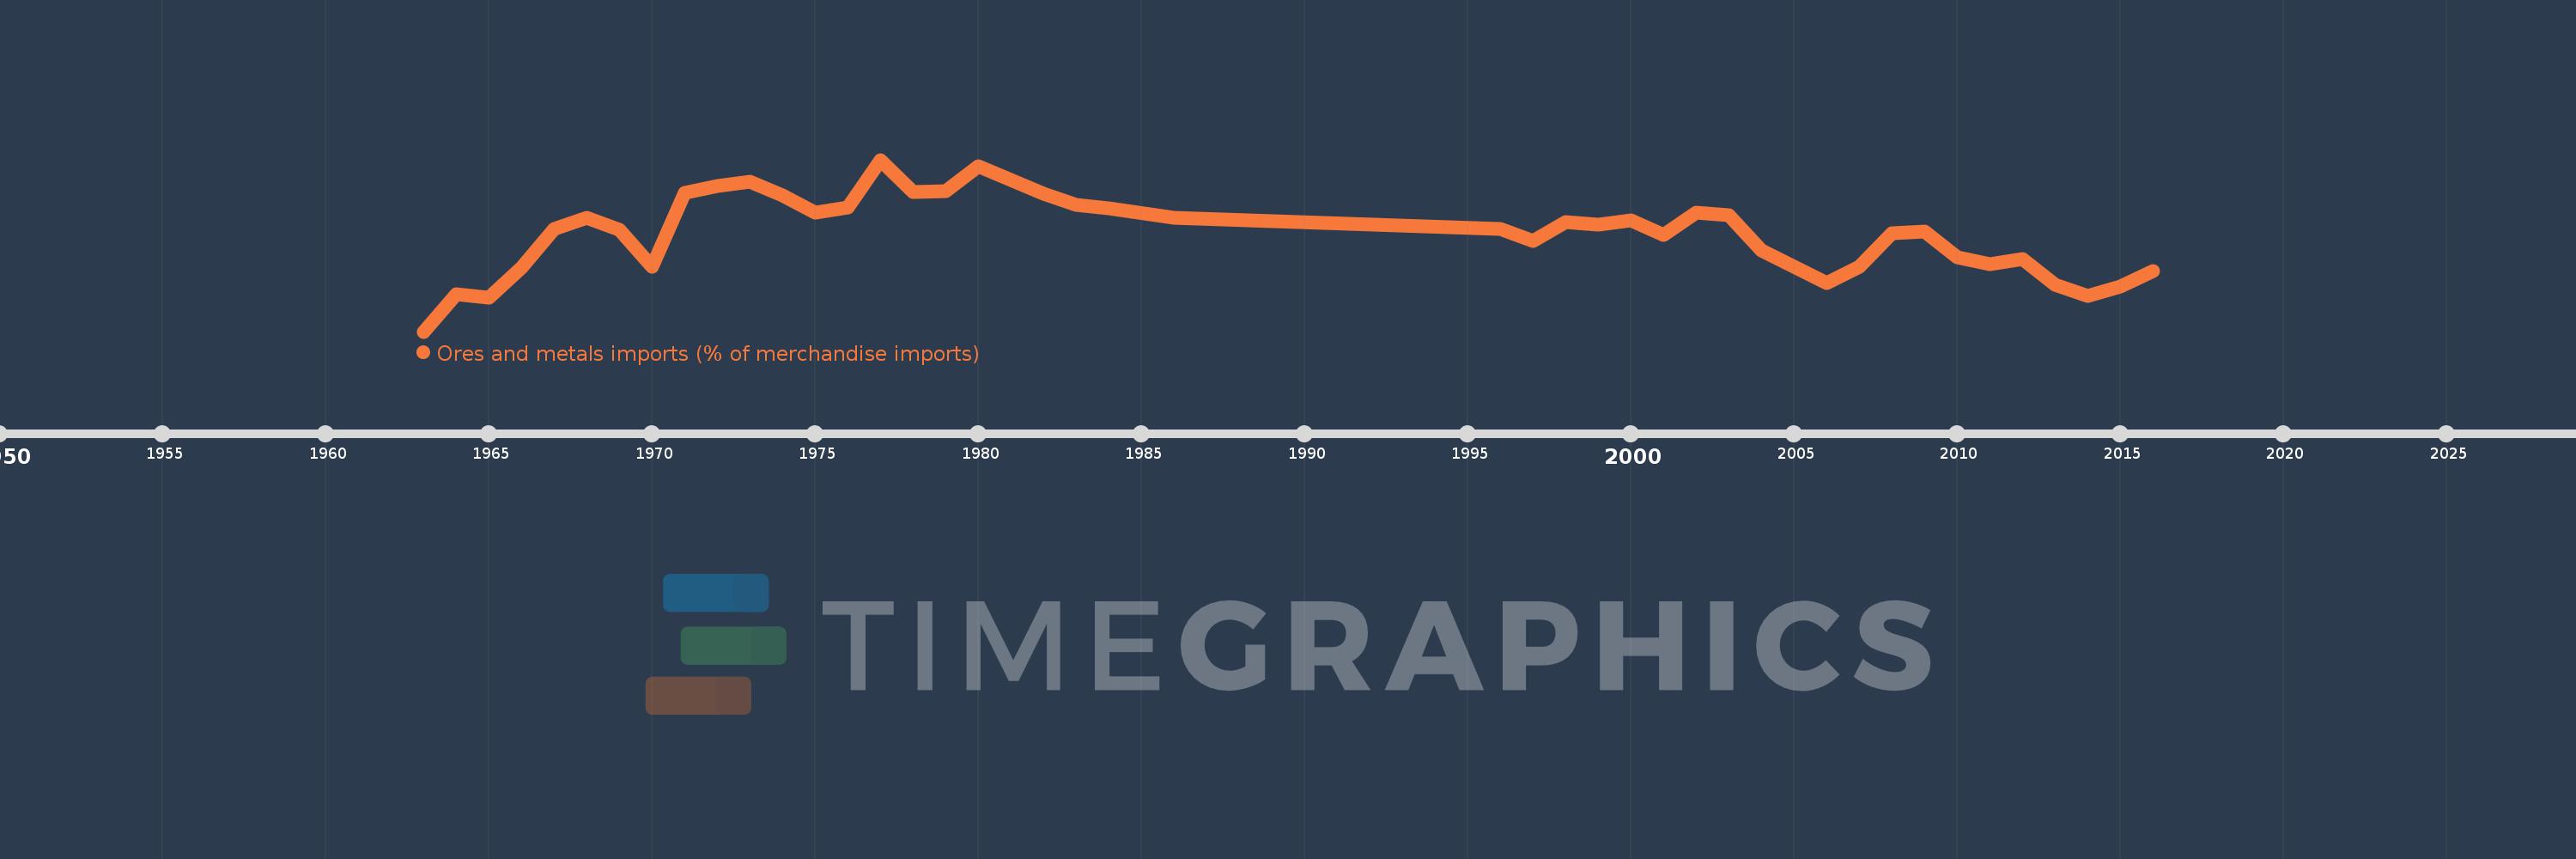
Ores and metals imports (% of merchandise imports)
2016,2015,2014,2013,2012,2011,2010,2009,2008,2007,2006,2005,2004,2003,2002,2001,2000,1999,1998,1997,1996,1986,1984,1983,1982,1980,1979,1978,1977,1976,1975,1974,1973,1972,1971,1970,1969,1968,1967,1966,1965,1964,1963
This statistics in other country:
AfghanistanAlbaniaAlgeriaAndorraAngolaAntigua and BarbudaArab WorldArgentinaArmeniaArubaAustraliaAustriaAzerbaijanBahamas, TheBahrainBangladeshBarbadosBelarusBelgiumBelizeBeninBermudaBhutanBoliviaBosnia and HerzegovinaBotswanaBrazilBrunei DarussalamBulgariaBurkina FasoBurundiCabo VerdeCambodiaCameroonCanadaCaribbean small statesCayman IslandsCentral African RepublicCentral Europe and the BalticsChadChileChinaColombiaComorosCongo, Dem. Rep.Congo, Rep.Costa RicaCote d'IvoireCroatiaCubaCyprusCzech RepublicDenmarkDjiboutiDominicaDominican RepublicEarly-demographic dividendEast Asia & PacificEast Asia & Pacific (excluding high income)East Asia & Pacific (IDA & IBRD countries)EcuadorEgypt, Arab Rep.El SalvadorEquatorial GuineaEritreaEstoniaEthiopiaEuro areaEurope & Central AsiaEurope & Central Asia (excluding high income)Europe & Central Asia (IDA & IBRD countries)European UnionFaroe IslandsFijiFinlandFragile and conflict affected situationsFranceFrench PolynesiaGabonGambia, TheGeorgiaGermanyGhanaGreeceGreenlandGrenadaGuatemalaGuineaGuinea-BissauGuyanaHaitiHeavily indebted poor countries (HIPC)High incomeHondurasHong Kong SAR, ChinaHungaryIBRD onlyIcelandIDA & IBRD totalIDA blendIDA onlyIDA totalIndiaIndonesiaIran, Islamic Rep.IraqIrelandIsraelItalyJamaicaJapanJordanKazakhstanKenyaKiribatiKorea, Rep.KuwaitKyrgyz RepublicLao PDRLate-demographic dividendLatin America & Caribbean Latin America & Caribbean (excluding high income)Latin America & the Caribbean (IDA & IBRD countries)LatviaLeast developed countries: UN classificationLebanonLesothoLiberiaLibyaLithuaniaLow & middle incomeLow incomeLower middle incomeLuxembourgMacao SAR, ChinaMacedonia, FYRMadagascarMalawiMalaysiaMaldivesMaliMaltaMauritaniaMauritiusMexicoMiddle East & North AfricaMiddle East & North Africa (excluding high income)Middle East & North Africa (IDA & IBRD countries)Middle incomeMoldovaMongoliaMoroccoMozambiqueMyanmarNamibiaNepalNetherlandsNew CaledoniaNew ZealandNicaraguaNigerNigeriaNorth AmericaNorwayOECD membersOmanOther small statesPacific island small statesPakistanPalauPanamaPapua New GuineaParaguayPeruPhilippinesPolandPortugalPost-demographic dividendPre-demographic dividendQatarRomaniaRussian FederationRwandaSamoaSao Tome and PrincipeSaudi ArabiaSenegalSerbiaSeychellesSierra LeoneSingaporeSlovak RepublicSloveniaSmall statesSolomon IslandsSomaliaSouth AfricaSouth AsiaSouth Asia (IDA & IBRD)SpainSri LankaSt. Kitts and NevisSt. LuciaSt. Vincent and the GrenadinesSub-Saharan Africa Sub-Saharan Africa (excluding high income)Sub-Saharan Africa (IDA & IBRD countries)SudanSurinameSwazilandSwedenSwitzerlandSyrian Arab RepublicTajikistanTanzaniaThailandTimor-LesteTogoTongaTrinidad and TobagoTunisiaTurkeyTurkmenistanTurks and Caicos IslandsTuvaluUgandaUkraineUnited Arab EmiratesUnited KingdomUnited StatesUpper middle incomeUruguayVanuatuVenezuela, RBVietnamVirgin Islands (U.S.)WorldYemen, Rep.ZambiaZimbabwe Timeline:
This timeline shows a graph from 1963 to 2016 of Cote d'Ivoire. No data until 1962. Number of actual observations by date: 43.
Source name:
World Development Indicators
Source organization:
World Bank staff estimates from the Comtrade database maintained by the United Nations Statistics Division.
Categories, topics:
Energy & Mining, Private Sector, Trade
Last updated:
apr 23, 2017
Indicators value changes by year
At the date of observation
Value
Absolute change
Change from previous value
jan 1, 1963
0.517
+0.517
0.0%
jan 1, 1964
0.871
+0.355
68.68%
jan 1, 1965
0.838
-0.033
-3.81%
jan 1, 1966
1.128
+0.289
34.52%
jan 1, 1967
1.492
+0.365
32.35%
jan 1, 1968
1.599
+0.107
7.15%
jan 1, 1969
1.483
-0.116
-7.27%
jan 1, 1970
1.13
-0.353
-23.82%
jan 1, 1971
1.834
+0.705
62.38%
jan 1, 1972
1.897
+0.063
3.44%
jan 1, 1973
1.939
+0.042
2.2%
jan 1, 1974
1.809
-0.13
-6.72%
jan 1, 1975
1.643
-0.166
-9.16%
jan 1, 1976
1.699
+0.056
3.4%
jan 1, 1977
2.148
+0.45
26.46%
jan 1, 1978
1.845
-0.303
-14.11%
jan 1, 1979
1.851
+0.006
0.3%
jan 1, 1980
2.083
+0.232
12.54%
jan 1, 1982
1.829
-0.254
-12.2%
jan 1, 1983
1.721
-0.108
-5.9%
jan 1, 1984
1.689
-0.032
-1.84%
jan 1, 1986
1.599
-0.09
-5.34%
jan 1, 1996
1.49
-0.109
-6.8%
jan 1, 1997
1.378
-0.113
-7.55%
jan 1, 1998
1.554
+0.177
12.83%
jan 1, 1999
1.536
-0.018
-1.18%
jan 1, 2000
1.572
+0.036
2.34%
jan 1, 2001
1.433
-0.139
-8.83%
jan 1, 2002
1.645
+0.212
14.76%
jan 1, 2003
1.618
-0.027
-1.62%
jan 1, 2004
1.29
-0.328
-20.3%
jan 1, 2005
1.13
-0.159
-12.36%
jan 1, 2006
0.981
-0.149
-13.19%
jan 1, 2007
1.131
+0.15
15.24%
jan 1, 2008
1.45
+0.32
28.26%
jan 1, 2009
1.47
+0.019
1.34%
jan 1, 2010
1.225
-0.245
-16.65%
jan 1, 2011
1.16
-0.065
-5.32%
jan 1, 2012
1.206
+0.046
3.97%
jan 1, 2013
0.962
-0.244
-20.2%
jan 1, 2014
0.852
-0.111
-11.5%
jan 1, 2015
0.949
+0.098
11.47%
jan 1, 2016
1.089
+0.14
14.71%
Ranking of countries by current statistics by years


Comments: