29
/
en
AIzaSyAYiBZKx7MnpbEhh9jyipgxe19OcubqV5w
April 1, 2024
139608
Germany
DEU
true
2
1
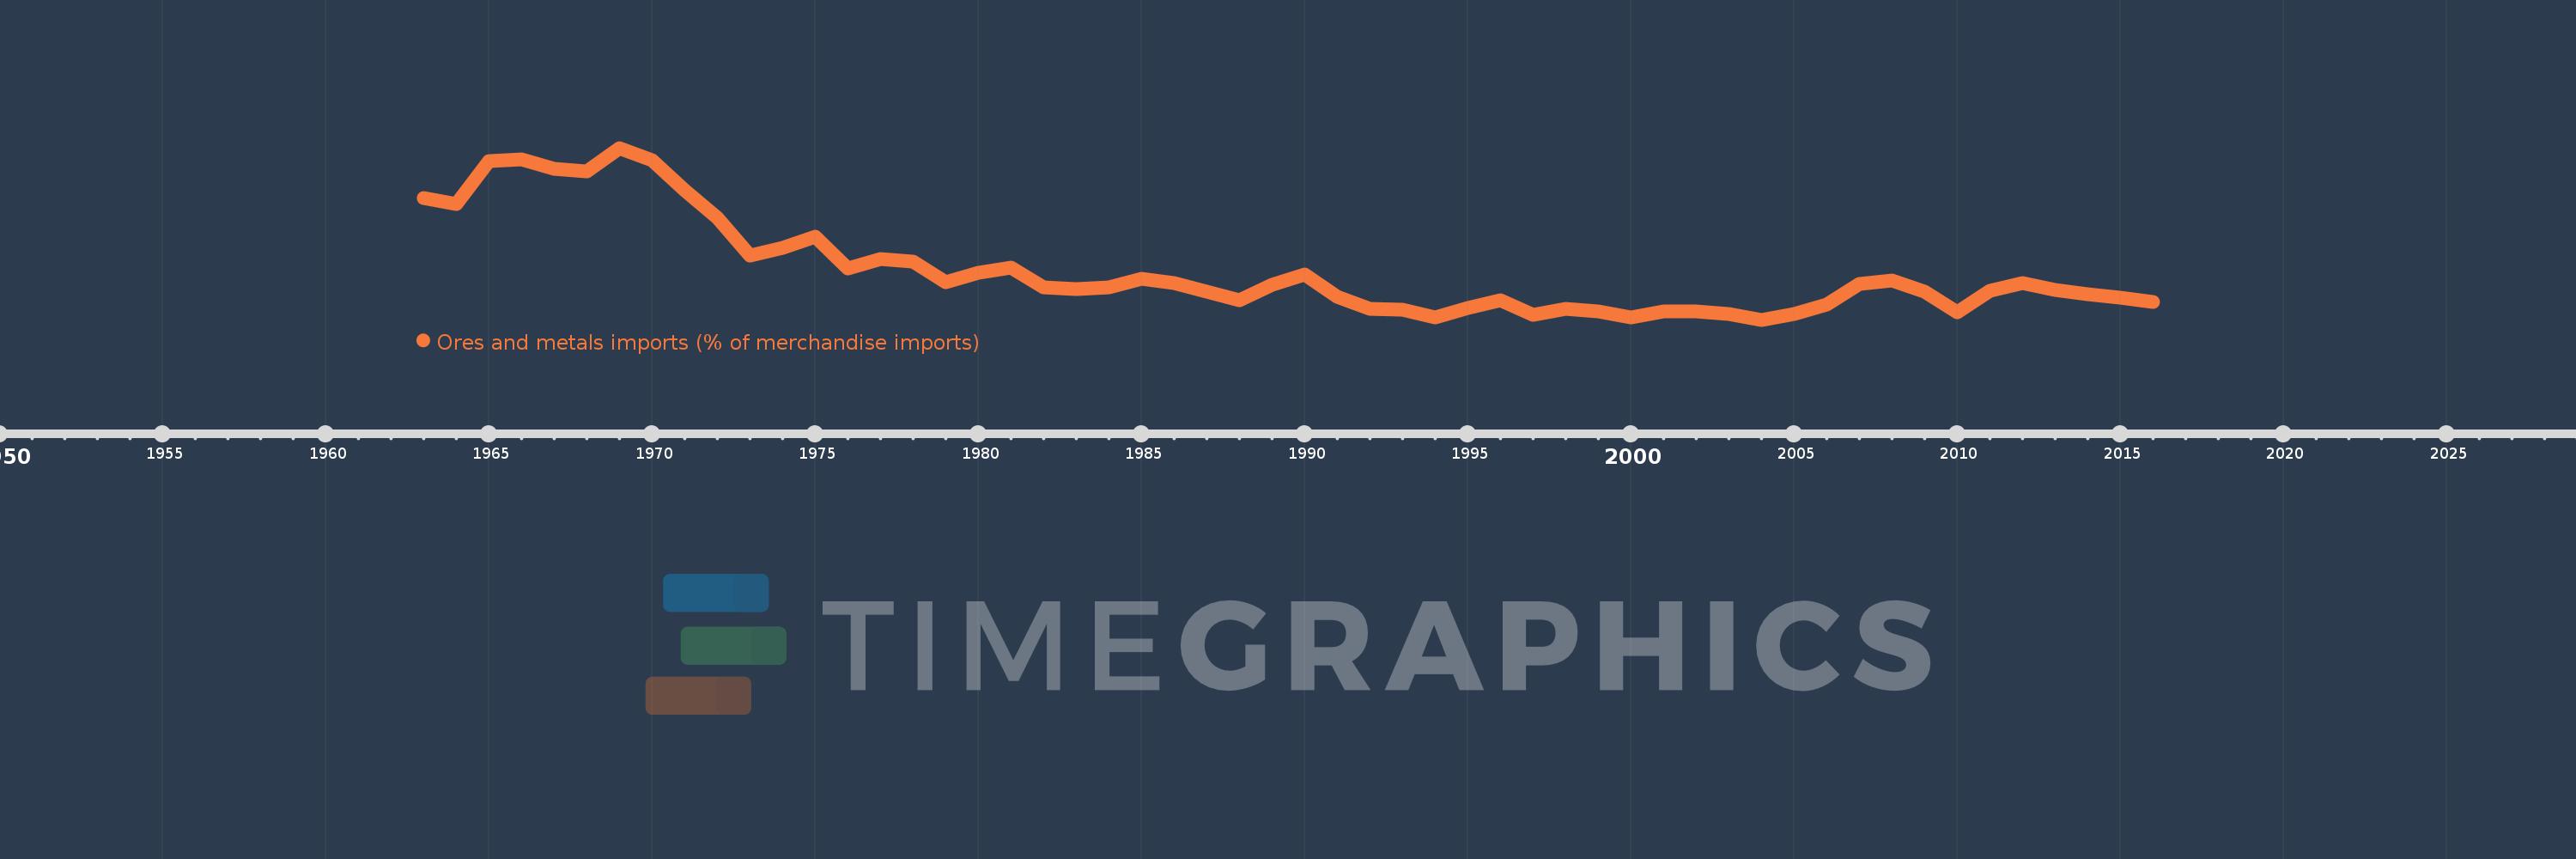
Ores and metals imports (% of merchandise imports)
2016,2015,2014,2013,2012,2011,2010,2009,2008,2007,2006,2005,2004,2003,2002,2001,2000,1999,1998,1997,1996,1995,1994,1993,1992,1991,1990,1989,1988,1987,1986,1985,1984,1983,1982,1981,1980,1979,1978,1977,1976,1975,1974,1973,1972,1971,1970,1969,1968,1967,1966,1965,1964,1963
This statistics in other country:
AfghanistanAlbaniaAlgeriaAndorraAngolaAntigua and BarbudaArab WorldArgentinaArmeniaArubaAustraliaAustriaAzerbaijanBahamas, TheBahrainBangladeshBarbadosBelarusBelgiumBelizeBeninBermudaBhutanBoliviaBosnia and HerzegovinaBotswanaBrazilBrunei DarussalamBulgariaBurkina FasoBurundiCabo VerdeCambodiaCameroonCanadaCaribbean small statesCayman IslandsCentral African RepublicCentral Europe and the BalticsChadChileChinaColombiaComorosCongo, Dem. Rep.Congo, Rep.Costa RicaCote d'IvoireCroatiaCubaCyprusCzech RepublicDenmarkDjiboutiDominicaDominican RepublicEarly-demographic dividendEast Asia & PacificEast Asia & Pacific (excluding high income)East Asia & Pacific (IDA & IBRD countries)EcuadorEgypt, Arab Rep.El SalvadorEquatorial GuineaEritreaEstoniaEthiopiaEuro areaEurope & Central AsiaEurope & Central Asia (excluding high income)Europe & Central Asia (IDA & IBRD countries)European UnionFaroe IslandsFijiFinlandFragile and conflict affected situationsFranceFrench PolynesiaGabonGambia, TheGeorgiaGermanyGhanaGreeceGreenlandGrenadaGuatemalaGuineaGuinea-BissauGuyanaHaitiHeavily indebted poor countries (HIPC)High incomeHondurasHong Kong SAR, ChinaHungaryIBRD onlyIcelandIDA & IBRD totalIDA blendIDA onlyIDA totalIndiaIndonesiaIran, Islamic Rep.IraqIrelandIsraelItalyJamaicaJapanJordanKazakhstanKenyaKiribatiKorea, Rep.KuwaitKyrgyz RepublicLao PDRLate-demographic dividendLatin America & Caribbean Latin America & Caribbean (excluding high income)Latin America & the Caribbean (IDA & IBRD countries)LatviaLeast developed countries: UN classificationLebanonLesothoLiberiaLibyaLithuaniaLow & middle incomeLow incomeLower middle incomeLuxembourgMacao SAR, ChinaMacedonia, FYRMadagascarMalawiMalaysiaMaldivesMaliMaltaMauritaniaMauritiusMexicoMiddle East & North AfricaMiddle East & North Africa (excluding high income)Middle East & North Africa (IDA & IBRD countries)Middle incomeMoldovaMongoliaMoroccoMozambiqueMyanmarNamibiaNepalNetherlandsNew CaledoniaNew ZealandNicaraguaNigerNigeriaNorth AmericaNorwayOECD membersOmanOther small statesPacific island small statesPakistanPalauPanamaPapua New GuineaParaguayPeruPhilippinesPolandPortugalPost-demographic dividendPre-demographic dividendQatarRomaniaRussian FederationRwandaSamoaSao Tome and PrincipeSaudi ArabiaSenegalSerbiaSeychellesSierra LeoneSingaporeSlovak RepublicSloveniaSmall statesSolomon IslandsSomaliaSouth AfricaSouth AsiaSouth Asia (IDA & IBRD)SpainSri LankaSt. Kitts and NevisSt. LuciaSt. Vincent and the GrenadinesSub-Saharan Africa Sub-Saharan Africa (excluding high income)Sub-Saharan Africa (IDA & IBRD countries)SudanSurinameSwazilandSwedenSwitzerlandSyrian Arab RepublicTajikistanTanzaniaThailandTimor-LesteTogoTongaTrinidad and TobagoTunisiaTurkeyTurkmenistanTurks and Caicos IslandsTuvaluUgandaUkraineUnited Arab EmiratesUnited KingdomUnited StatesUpper middle incomeUruguayVanuatuVenezuela, RBVietnamVirgin Islands (U.S.)WorldYemen, Rep.ZambiaZimbabwe Timeline:
This timeline shows a graph from 1963 to 2016 of Germany. No data until 1962. Number of actual observations by date: 54.
Source name:
World Development Indicators
Source organization:
World Bank staff estimates from the Comtrade database maintained by the United Nations Statistics Division.
Categories, topics:
Energy & Mining, Private Sector, Trade
Last updated:
apr 23, 2017
Indicators value changes by year
Maximum:
13.255
jan 1, 1969
At the date of observation
Value
Absolute change
Change from previous value
jan 1, 1963
10.297
+10.297
0.0%
jan 1, 1964
9.946
-0.351
-3.41%
jan 1, 1965
12.452
+2.506
25.19%
jan 1, 1966
12.587
+0.134
1.08%
jan 1, 1967
12.024
-0.563
-4.47%
jan 1, 1968
11.884
-0.14
-1.16%
jan 1, 1969
13.255
+1.371
11.54%
jan 1, 1970
12.504
-0.751
-5.67%
jan 1, 1971
10.72
-1.784
-14.27%
jan 1, 1972
9.122
-1.599
-14.91%
jan 1, 1973
6.89
-2.232
-24.46%
jan 1, 1974
7.346
+0.456
6.62%
jan 1, 1975
7.967
+0.621
8.45%
jan 1, 1976
6.103
-1.864
-23.39%
jan 1, 1977
6.66
+0.557
9.13%
jan 1, 1978
6.528
-0.132
-1.98%
jan 1, 1979
5.307
-1.222
-18.71%
jan 1, 1980
5.867
+0.561
10.56%
jan 1, 1981
6.145
+0.278
4.73%
jan 1, 1982
4.98
-1.165
-18.96%
jan 1, 1983
4.861
-0.118
-2.38%
jan 1, 1984
4.984
+0.123
2.53%
jan 1, 1985
5.48
+0.495
9.94%
jan 1, 1986
5.238
-0.242
-4.42%
jan 1, 1987
4.731
-0.506
-9.67%
jan 1, 1988
4.223
-0.508
-10.74%
jan 1, 1989
5.116
+0.892
21.13%
jan 1, 1990
5.732
+0.616
12.04%
jan 1, 1991
4.44
-1.292
-22.54%
jan 1, 1992
3.724
-0.716
-16.12%
jan 1, 1993
3.666
-0.057
-1.54%
jan 1, 1994
3.213
-0.453
-12.36%
jan 1, 1995
3.747
+0.533
16.6%
jan 1, 1996
4.192
+0.445
11.88%
jan 1, 1997
3.353
-0.838
-20.0%
jan 1, 1998
3.7
+0.346
10.33%
jan 1, 1999
3.541
-0.159
-4.29%
jan 1, 2000
3.173
-0.368
-10.39%
jan 1, 2001
3.532
+0.359
11.31%
jan 1, 2002
3.537
+0.005
0.13%
jan 1, 2003
3.42
-0.116
-3.29%
jan 1, 2004
3.055
-0.366
-10.69%
jan 1, 2005
3.418
+0.363
11.89%
jan 1, 2006
3.95
+0.532
15.57%
jan 1, 2007
5.176
+1.226
31.05%
jan 1, 2008
5.396
+0.22
4.25%
jan 1, 2009
4.74
-0.656
-12.16%
jan 1, 2010
3.483
-1.257
-26.52%
jan 1, 2011
4.782
+1.299
37.28%
jan 1, 2012
5.227
+0.446
9.32%
jan 1, 2013
4.819
-0.408
-7.81%
jan 1, 2014
4.55
-0.27
-5.59%
jan 1, 2015
4.368
-0.182
-4.0%
jan 1, 2016
4.128
-0.24
-5.49%
Ranking of countries by current statistics by years


Comments: