29
/
en
AIzaSyAYiBZKx7MnpbEhh9jyipgxe19OcubqV5w
April 1, 2024
155058
India
IND
true
2
1
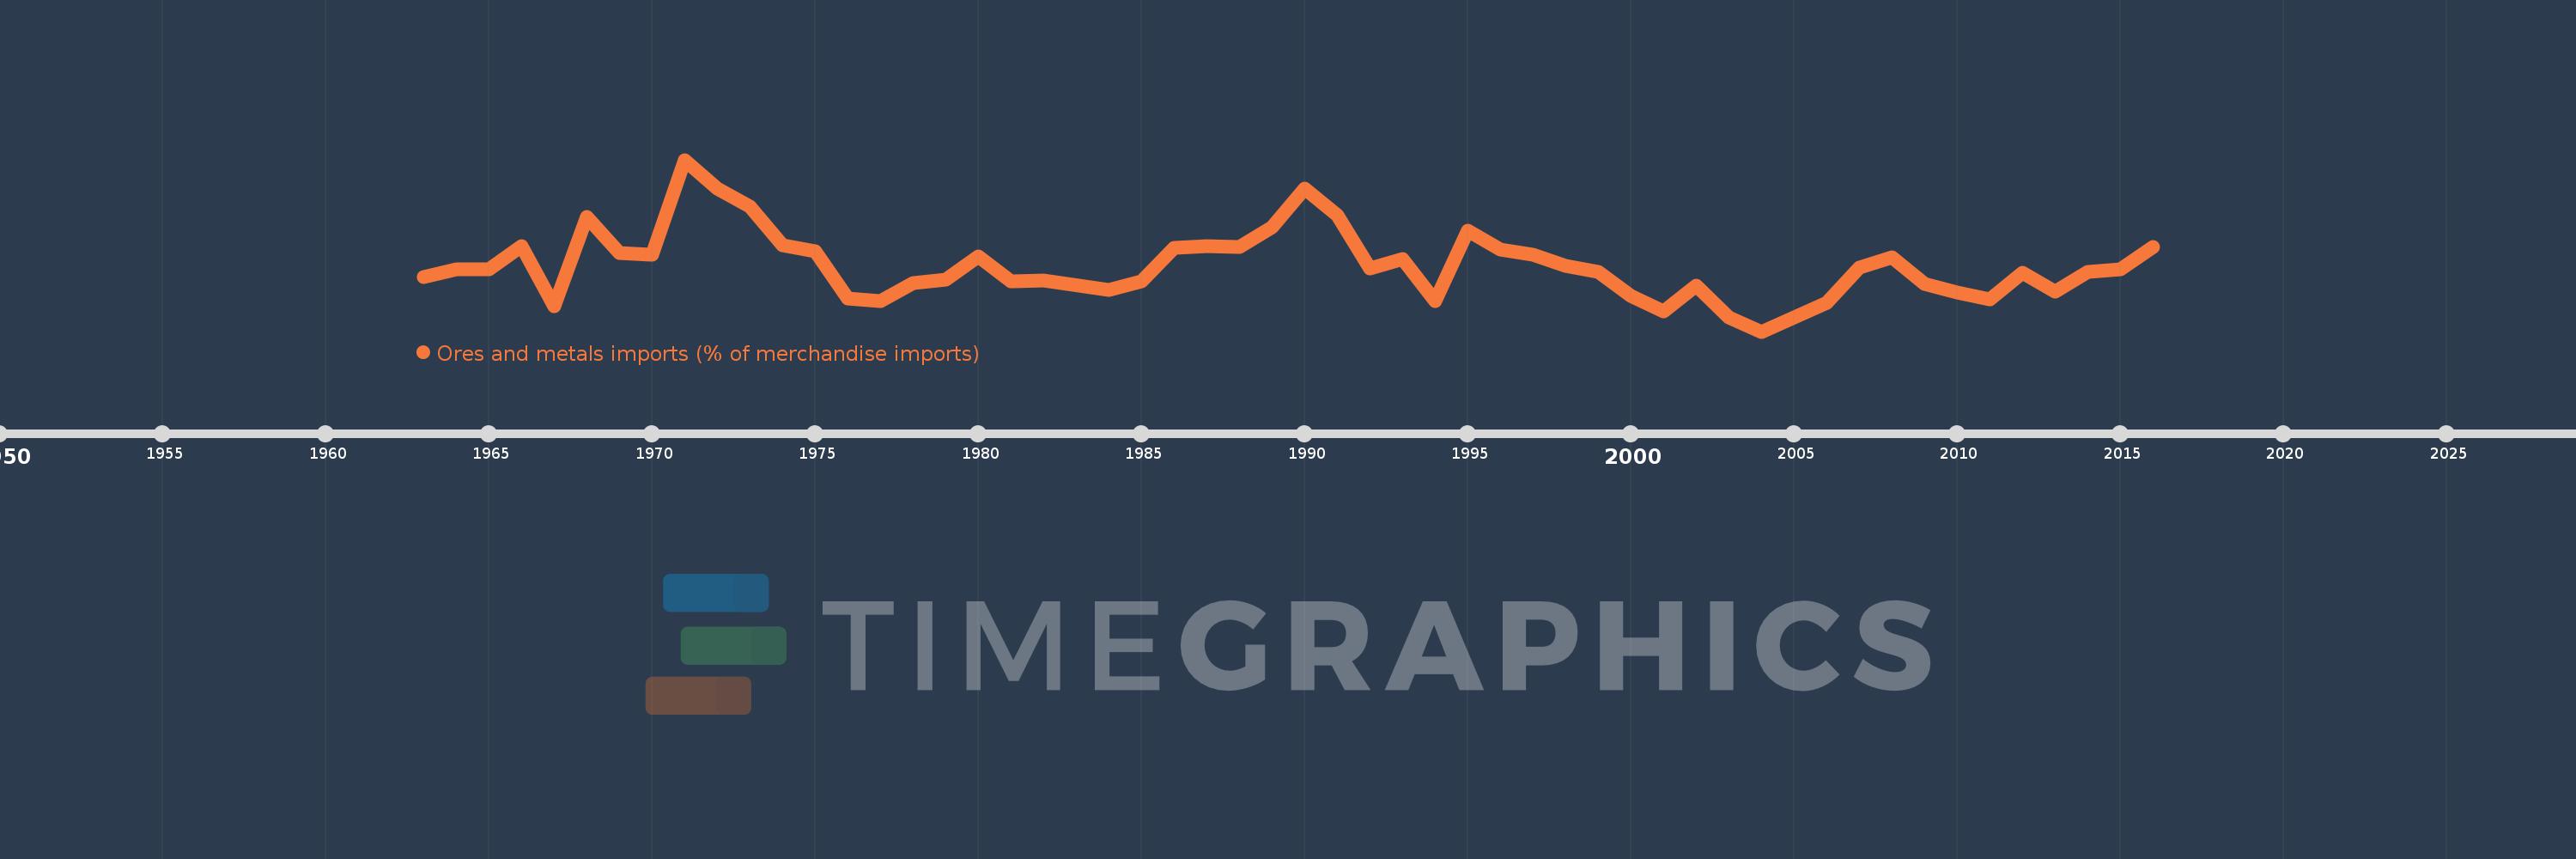
Ores and metals imports (% of merchandise imports)
2016,2015,2014,2013,2012,2011,2010,2009,2008,2007,2006,2005,2004,2003,2002,2001,2000,1999,1998,1997,1996,1995,1994,1993,1992,1991,1990,1989,1988,1987,1986,1985,1984,1982,1981,1980,1979,1978,1977,1976,1975,1974,1973,1972,1971,1970,1969,1968,1967,1966,1965,1964,1963
This statistics in other country:
AfghanistanAlbaniaAlgeriaAndorraAngolaAntigua and BarbudaArab WorldArgentinaArmeniaArubaAustraliaAustriaAzerbaijanBahamas, TheBahrainBangladeshBarbadosBelarusBelgiumBelizeBeninBermudaBhutanBoliviaBosnia and HerzegovinaBotswanaBrazilBrunei DarussalamBulgariaBurkina FasoBurundiCabo VerdeCambodiaCameroonCanadaCaribbean small statesCayman IslandsCentral African RepublicCentral Europe and the BalticsChadChileChinaColombiaComorosCongo, Dem. Rep.Congo, Rep.Costa RicaCote d'IvoireCroatiaCubaCyprusCzech RepublicDenmarkDjiboutiDominicaDominican RepublicEarly-demographic dividendEast Asia & PacificEast Asia & Pacific (excluding high income)East Asia & Pacific (IDA & IBRD countries)EcuadorEgypt, Arab Rep.El SalvadorEquatorial GuineaEritreaEstoniaEthiopiaEuro areaEurope & Central AsiaEurope & Central Asia (excluding high income)Europe & Central Asia (IDA & IBRD countries)European UnionFaroe IslandsFijiFinlandFragile and conflict affected situationsFranceFrench PolynesiaGabonGambia, TheGeorgiaGermanyGhanaGreeceGreenlandGrenadaGuatemalaGuineaGuinea-BissauGuyanaHaitiHeavily indebted poor countries (HIPC)High incomeHondurasHong Kong SAR, ChinaHungaryIBRD onlyIcelandIDA & IBRD totalIDA blendIDA onlyIDA totalIndiaIndonesiaIran, Islamic Rep.IraqIrelandIsraelItalyJamaicaJapanJordanKazakhstanKenyaKiribatiKorea, Rep.KuwaitKyrgyz RepublicLao PDRLate-demographic dividendLatin America & Caribbean Latin America & Caribbean (excluding high income)Latin America & the Caribbean (IDA & IBRD countries)LatviaLeast developed countries: UN classificationLebanonLesothoLiberiaLibyaLithuaniaLow & middle incomeLow incomeLower middle incomeLuxembourgMacao SAR, ChinaMacedonia, FYRMadagascarMalawiMalaysiaMaldivesMaliMaltaMauritaniaMauritiusMexicoMiddle East & North AfricaMiddle East & North Africa (excluding high income)Middle East & North Africa (IDA & IBRD countries)Middle incomeMoldovaMongoliaMoroccoMozambiqueMyanmarNamibiaNepalNetherlandsNew CaledoniaNew ZealandNicaraguaNigerNigeriaNorth AmericaNorwayOECD membersOmanOther small statesPacific island small statesPakistanPalauPanamaPapua New GuineaParaguayPeruPhilippinesPolandPortugalPost-demographic dividendPre-demographic dividendQatarRomaniaRussian FederationRwandaSamoaSao Tome and PrincipeSaudi ArabiaSenegalSerbiaSeychellesSierra LeoneSingaporeSlovak RepublicSloveniaSmall statesSolomon IslandsSomaliaSouth AfricaSouth AsiaSouth Asia (IDA & IBRD)SpainSri LankaSt. Kitts and NevisSt. LuciaSt. Vincent and the GrenadinesSub-Saharan Africa Sub-Saharan Africa (excluding high income)Sub-Saharan Africa (IDA & IBRD countries)SudanSurinameSwazilandSwedenSwitzerlandSyrian Arab RepublicTajikistanTanzaniaThailandTimor-LesteTogoTongaTrinidad and TobagoTunisiaTurkeyTurkmenistanTurks and Caicos IslandsTuvaluUgandaUkraineUnited Arab EmiratesUnited KingdomUnited StatesUpper middle incomeUruguayVanuatuVenezuela, RBVietnamVirgin Islands (U.S.)WorldYemen, Rep.ZambiaZimbabwe Timeline:
This timeline shows a graph from 1963 to 2016 of India. No data until 1962. Number of actual observations by date: 53.
Source name:
World Development Indicators
Source organization:
World Bank staff estimates from the Comtrade database maintained by the United Nations Statistics Division.
Categories, topics:
Energy & Mining, Private Sector, Trade
Last updated:
apr 23, 2017
Indicators value changes by year
At the date of observation
Value
Absolute change
Change from previous value
jan 1, 1963
6.07
+6.07
0.0%
jan 1, 1964
6.322
+0.252
4.15%
jan 1, 1965
6.326
+0.004
0.07%
jan 1, 1966
7.062
+0.736
11.64%
jan 1, 1967
5.118
-1.944
-27.52%
jan 1, 1968
8.008
+2.89
56.46%
jan 1, 1969
6.839
-1.169
-14.6%
jan 1, 1970
6.783
-0.057
-0.83%
jan 1, 1971
9.871
+3.089
45.54%
jan 1, 1972
8.934
-0.937
-9.49%
jan 1, 1973
8.349
-0.585
-6.55%
jan 1, 1974
7.106
-1.243
-14.88%
jan 1, 1975
6.907
-0.199
-2.81%
jan 1, 1976
5.378
-1.529
-22.13%
jan 1, 1977
5.281
-0.097
-1.81%
jan 1, 1978
5.88
+0.6
11.35%
jan 1, 1979
5.977
+0.097
1.65%
jan 1, 1980
6.736
+0.758
12.69%
jan 1, 1981
5.93
-0.806
-11.96%
jan 1, 1982
5.954
+0.024
0.41%
jan 1, 1984
5.646
-0.308
-5.18%
jan 1, 1985
5.943
+0.297
5.27%
jan 1, 1986
7.016
+1.073
18.06%
jan 1, 1987
7.062
+0.046
0.65%
jan 1, 1988
7.058
-0.004
-0.06%
jan 1, 1989
7.69
+0.632
8.95%
jan 1, 1990
8.931
+1.241
16.13%
jan 1, 1991
8.072
-0.859
-9.62%
jan 1, 1992
6.339
-1.733
-21.47%
jan 1, 1993
6.649
+0.311
4.9%
jan 1, 1994
5.28
-1.369
-20.59%
jan 1, 1995
7.562
+2.282
43.22%
jan 1, 1996
6.953
-0.61
-8.06%
jan 1, 1997
6.792
-0.161
-2.32%
jan 1, 1998
6.448
-0.344
-5.06%
jan 1, 1999
6.247
-0.201
-3.12%
jan 1, 2000
5.463
-0.784
-12.55%
jan 1, 2001
4.951
-0.512
-9.37%
jan 1, 2002
5.782
+0.831
16.79%
jan 1, 2003
4.76
-1.022
-17.67%
jan 1, 2004
4.306
-0.454
-9.53%
jan 1, 2005
4.763
+0.457
10.61%
jan 1, 2006
5.226
+0.463
9.72%
jan 1, 2007
6.379
+1.152
22.05%
jan 1, 2008
6.724
+0.346
5.42%
jan 1, 2009
5.847
-0.878
-13.05%
jan 1, 2010
5.564
-0.282
-4.83%
jan 1, 2011
5.345
-0.219
-3.94%
jan 1, 2012
6.216
+0.871
16.3%
jan 1, 2013
5.588
-0.628
-10.1%
jan 1, 2014
6.252
+0.664
11.88%
jan 1, 2015
6.32
+0.068
1.08%
jan 1, 2016
7.044
+0.724
11.46%
Ranking of countries by current statistics by years


Comments: