29
/
en
AIzaSyAYiBZKx7MnpbEhh9jyipgxe19OcubqV5w
April 1, 2024
258739
Syrian Arab Republic
SYR
true
2
1
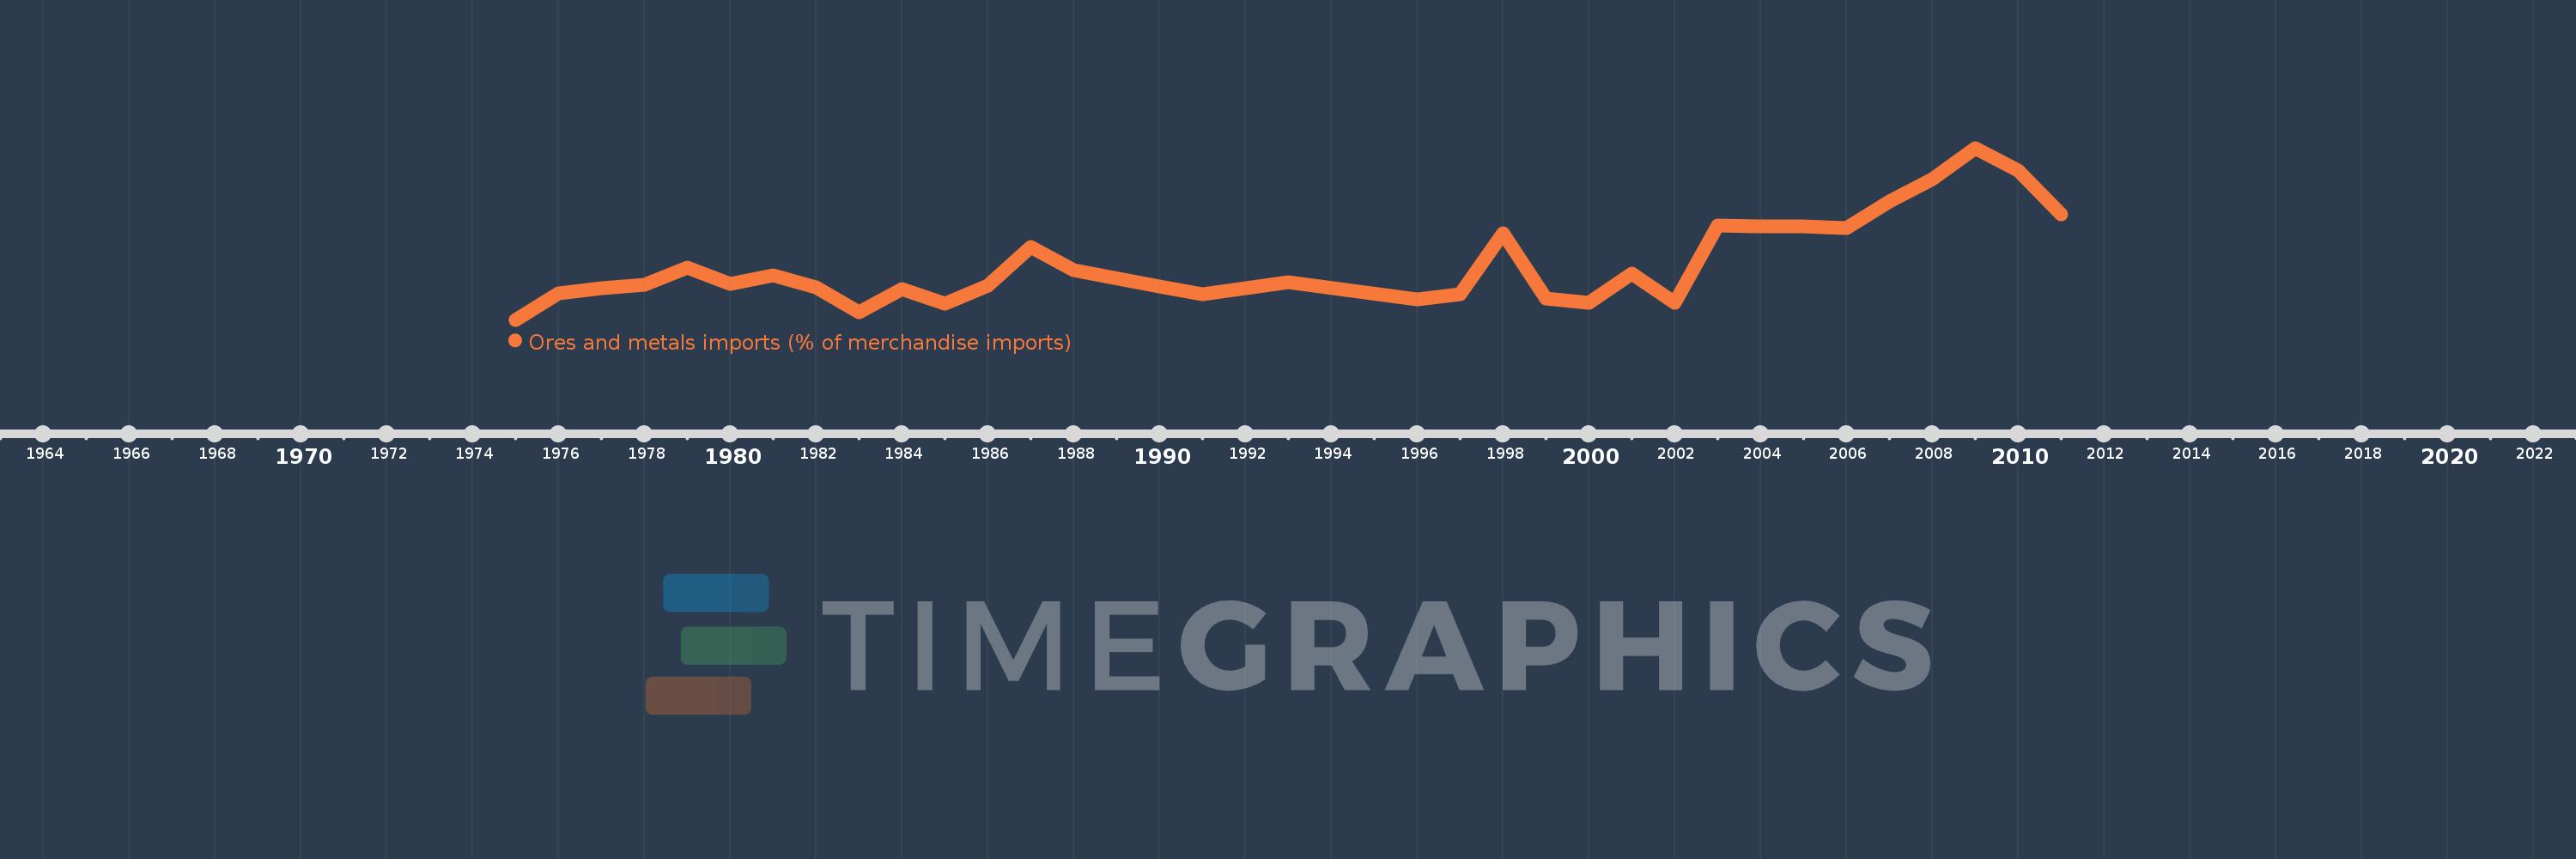
Ores and metals imports (% of merchandise imports)
2011,2010,2009,2008,2007,2006,2005,2004,2003,2002,2001,2000,1999,1998,1997,1996,1993,1991,1990,1988,1987,1986,1985,1984,1983,1982,1981,1980,1979,1978,1977,1976,1975
This statistics in other country:
AfghanistanAlbaniaAlgeriaAndorraAngolaAntigua and BarbudaArab WorldArgentinaArmeniaArubaAustraliaAustriaAzerbaijanBahamas, TheBahrainBangladeshBarbadosBelarusBelgiumBelizeBeninBermudaBhutanBoliviaBosnia and HerzegovinaBotswanaBrazilBrunei DarussalamBulgariaBurkina FasoBurundiCabo VerdeCambodiaCameroonCanadaCaribbean small statesCayman IslandsCentral African RepublicCentral Europe and the BalticsChadChileChinaColombiaComorosCongo, Dem. Rep.Congo, Rep.Costa RicaCote d'IvoireCroatiaCubaCyprusCzech RepublicDenmarkDjiboutiDominicaDominican RepublicEarly-demographic dividendEast Asia & PacificEast Asia & Pacific (excluding high income)East Asia & Pacific (IDA & IBRD countries)EcuadorEgypt, Arab Rep.El SalvadorEquatorial GuineaEritreaEstoniaEthiopiaEuro areaEurope & Central AsiaEurope & Central Asia (excluding high income)Europe & Central Asia (IDA & IBRD countries)European UnionFaroe IslandsFijiFinlandFragile and conflict affected situationsFranceFrench PolynesiaGabonGambia, TheGeorgiaGermanyGhanaGreeceGreenlandGrenadaGuatemalaGuineaGuinea-BissauGuyanaHaitiHeavily indebted poor countries (HIPC)High incomeHondurasHong Kong SAR, ChinaHungaryIBRD onlyIcelandIDA & IBRD totalIDA blendIDA onlyIDA totalIndiaIndonesiaIran, Islamic Rep.IraqIrelandIsraelItalyJamaicaJapanJordanKazakhstanKenyaKiribatiKorea, Rep.KuwaitKyrgyz RepublicLao PDRLate-demographic dividendLatin America & Caribbean Latin America & Caribbean (excluding high income)Latin America & the Caribbean (IDA & IBRD countries)LatviaLeast developed countries: UN classificationLebanonLesothoLiberiaLibyaLithuaniaLow & middle incomeLow incomeLower middle incomeLuxembourgMacao SAR, ChinaMacedonia, FYRMadagascarMalawiMalaysiaMaldivesMaliMaltaMauritaniaMauritiusMexicoMiddle East & North AfricaMiddle East & North Africa (excluding high income)Middle East & North Africa (IDA & IBRD countries)Middle incomeMoldovaMongoliaMoroccoMozambiqueMyanmarNamibiaNepalNetherlandsNew CaledoniaNew ZealandNicaraguaNigerNigeriaNorth AmericaNorwayOECD membersOmanOther small statesPacific island small statesPakistanPalauPanamaPapua New GuineaParaguayPeruPhilippinesPolandPortugalPost-demographic dividendPre-demographic dividendQatarRomaniaRussian FederationRwandaSamoaSao Tome and PrincipeSaudi ArabiaSenegalSerbiaSeychellesSierra LeoneSingaporeSlovak RepublicSloveniaSmall statesSolomon IslandsSomaliaSouth AfricaSouth AsiaSouth Asia (IDA & IBRD)SpainSri LankaSt. Kitts and NevisSt. LuciaSt. Vincent and the GrenadinesSub-Saharan Africa Sub-Saharan Africa (excluding high income)Sub-Saharan Africa (IDA & IBRD countries)SudanSurinameSwazilandSwedenSwitzerlandSyrian Arab RepublicTajikistanTanzaniaThailandTimor-LesteTogoTongaTrinidad and TobagoTunisiaTurkeyTurkmenistanTurks and Caicos IslandsTuvaluUgandaUkraineUnited Arab EmiratesUnited KingdomUnited StatesUpper middle incomeUruguayVanuatuVenezuela, RBVietnamVirgin Islands (U.S.)WorldYemen, Rep.ZambiaZimbabwe Timeline:
This timeline shows a graph from 1975 to 2011 of Syrian Arab Republic. No data until 1974. Number of actual observations by date: 33.
Source name:
World Development Indicators
Source organization:
World Bank staff estimates from the Comtrade database maintained by the United Nations Statistics Division.
Categories, topics:
Energy & Mining, Private Sector, Trade
Last updated:
apr 23, 2017
Indicators value changes by year
At the date of observation
Value
Absolute change
Change from previous value
jan 1, 1975
0.963
+0.963
0.0%
jan 1, 1976
1.447
+0.484
50.22%
jan 1, 1977
1.532
+0.085
5.85%
jan 1, 1978
1.6
+0.068
4.42%
jan 1, 1979
1.907
+0.308
19.22%
jan 1, 1980
1.612
-0.296
-15.5%
jan 1, 1981
1.776
+0.164
10.19%
jan 1, 1982
1.559
-0.217
-12.2%
jan 1, 1983
1.101
-0.458
-29.38%
jan 1, 1984
1.52
+0.419
38.04%
jan 1, 1985
1.252
-0.268
-17.63%
jan 1, 1986
1.588
+0.335
26.78%
jan 1, 1987
2.282
+0.695
43.76%
jan 1, 1988
1.86
-0.422
-18.5%
jan 1, 1990
1.571
-0.289
-15.52%
jan 1, 1991
1.424
-0.147
-9.38%
jan 1, 1993
1.646
+0.223
15.63%
jan 1, 1996
1.338
-0.308
-18.73%
jan 1, 1997
1.432
+0.094
7.01%
jan 1, 1998
2.543
+1.111
77.58%
jan 1, 1999
1.345
-1.197
-47.1%
jan 1, 2000
1.269
-0.076
-5.64%
jan 1, 2001
1.802
+0.533
41.97%
jan 1, 2002
1.279
-0.523
-29.04%
jan 1, 2003
2.684
+1.405
109.9%
jan 1, 2004
2.667
-0.017
-0.65%
jan 1, 2005
2.657
-0.009
-0.35%
jan 1, 2006
2.636
-0.022
-0.82%
jan 1, 2007
3.119
+0.484
18.35%
jan 1, 2008
3.531
+0.412
13.2%
jan 1, 2009
4.094
+0.563
15.95%
jan 1, 2010
3.675
-0.419
-10.23%
jan 1, 2011
2.884
-0.79
-21.51%
Ranking of countries by current statistics by years


Comments: