29
/
en
AIzaSyAYiBZKx7MnpbEhh9jyipgxe19OcubqV5w
April 1, 2024
188228
Malaysia
MYS
true
2
1
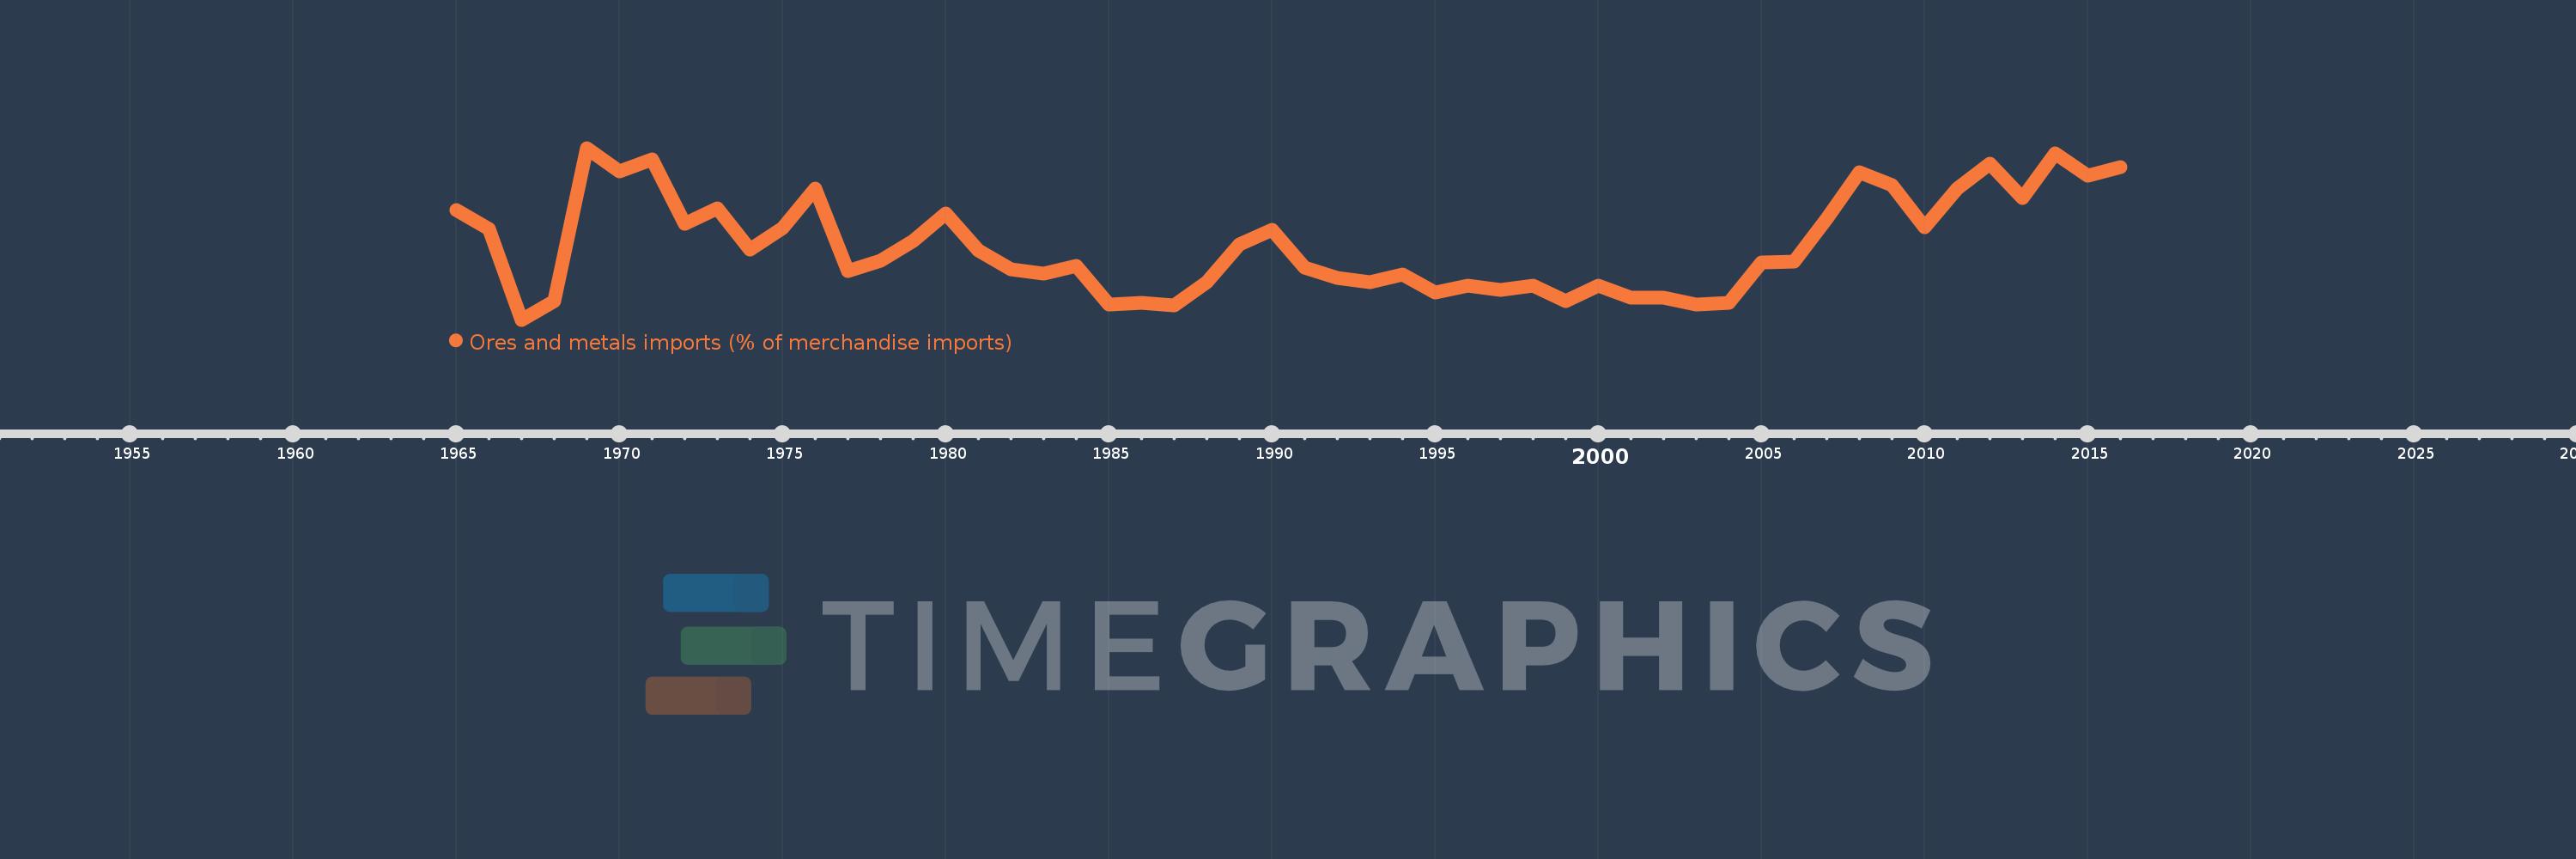
Ores and metals imports (% of merchandise imports)
2016,2015,2014,2013,2012,2011,2010,2009,2008,2007,2006,2005,2004,2003,2002,2001,2000,1999,1998,1997,1996,1995,1994,1993,1992,1991,1990,1989,1988,1987,1986,1985,1984,1983,1982,1981,1980,1979,1978,1977,1976,1975,1974,1973,1972,1971,1970,1969,1968,1967,1966,1965
This statistics in other country:
AfghanistanAlbaniaAlgeriaAndorraAngolaAntigua and BarbudaArab WorldArgentinaArmeniaArubaAustraliaAustriaAzerbaijanBahamas, TheBahrainBangladeshBarbadosBelarusBelgiumBelizeBeninBermudaBhutanBoliviaBosnia and HerzegovinaBotswanaBrazilBrunei DarussalamBulgariaBurkina FasoBurundiCabo VerdeCambodiaCameroonCanadaCaribbean small statesCayman IslandsCentral African RepublicCentral Europe and the BalticsChadChileChinaColombiaComorosCongo, Dem. Rep.Congo, Rep.Costa RicaCote d'IvoireCroatiaCubaCyprusCzech RepublicDenmarkDjiboutiDominicaDominican RepublicEarly-demographic dividendEast Asia & PacificEast Asia & Pacific (excluding high income)East Asia & Pacific (IDA & IBRD countries)EcuadorEgypt, Arab Rep.El SalvadorEquatorial GuineaEritreaEstoniaEthiopiaEuro areaEurope & Central AsiaEurope & Central Asia (excluding high income)Europe & Central Asia (IDA & IBRD countries)European UnionFaroe IslandsFijiFinlandFragile and conflict affected situationsFranceFrench PolynesiaGabonGambia, TheGeorgiaGermanyGhanaGreeceGreenlandGrenadaGuatemalaGuineaGuinea-BissauGuyanaHaitiHeavily indebted poor countries (HIPC)High incomeHondurasHong Kong SAR, ChinaHungaryIBRD onlyIcelandIDA & IBRD totalIDA blendIDA onlyIDA totalIndiaIndonesiaIran, Islamic Rep.IraqIrelandIsraelItalyJamaicaJapanJordanKazakhstanKenyaKiribatiKorea, Rep.KuwaitKyrgyz RepublicLao PDRLate-demographic dividendLatin America & Caribbean Latin America & Caribbean (excluding high income)Latin America & the Caribbean (IDA & IBRD countries)LatviaLeast developed countries: UN classificationLebanonLesothoLiberiaLibyaLithuaniaLow & middle incomeLow incomeLower middle incomeLuxembourgMacao SAR, ChinaMacedonia, FYRMadagascarMalawiMalaysiaMaldivesMaliMaltaMauritaniaMauritiusMexicoMiddle East & North AfricaMiddle East & North Africa (excluding high income)Middle East & North Africa (IDA & IBRD countries)Middle incomeMoldovaMongoliaMoroccoMozambiqueMyanmarNamibiaNepalNetherlandsNew CaledoniaNew ZealandNicaraguaNigerNigeriaNorth AmericaNorwayOECD membersOmanOther small statesPacific island small statesPakistanPalauPanamaPapua New GuineaParaguayPeruPhilippinesPolandPortugalPost-demographic dividendPre-demographic dividendQatarRomaniaRussian FederationRwandaSamoaSao Tome and PrincipeSaudi ArabiaSenegalSerbiaSeychellesSierra LeoneSingaporeSlovak RepublicSloveniaSmall statesSolomon IslandsSomaliaSouth AfricaSouth AsiaSouth Asia (IDA & IBRD)SpainSri LankaSt. Kitts and NevisSt. LuciaSt. Vincent and the GrenadinesSub-Saharan Africa Sub-Saharan Africa (excluding high income)Sub-Saharan Africa (IDA & IBRD countries)SudanSurinameSwazilandSwedenSwitzerlandSyrian Arab RepublicTajikistanTanzaniaThailandTimor-LesteTogoTongaTrinidad and TobagoTunisiaTurkeyTurkmenistanTurks and Caicos IslandsTuvaluUgandaUkraineUnited Arab EmiratesUnited KingdomUnited StatesUpper middle incomeUruguayVanuatuVenezuela, RBVietnamVirgin Islands (U.S.)WorldYemen, Rep.ZambiaZimbabwe Timeline:
This timeline shows a graph from 1965 to 2016 of Malaysia. No data until 1964. Number of actual observations by date: 52.
Source name:
World Development Indicators
Source organization:
World Bank staff estimates from the Comtrade database maintained by the United Nations Statistics Division.
Categories, topics:
Energy & Mining, Private Sector, Trade
Last updated:
apr 23, 2017
Indicators value changes by year
At the date of observation
Value
Absolute change
Change from previous value
jan 1, 1965
4.799
+4.799
0.0%
jan 1, 1966
4.422
-0.377
-7.85%
jan 1, 1967
2.583
-1.839
-41.58%
jan 1, 1968
2.96
+0.377
14.6%
jan 1, 1969
6.064
+3.104
104.87%
jan 1, 1970
5.595
-0.47
-7.75%
jan 1, 1971
5.827
+0.232
4.15%
jan 1, 1972
4.533
-1.293
-22.2%
jan 1, 1973
4.845
+0.312
6.87%
jan 1, 1974
3.997
-0.848
-17.5%
jan 1, 1975
4.438
+0.441
11.02%
jan 1, 1976
5.241
+0.804
18.11%
jan 1, 1977
3.564
-1.678
-32.01%
jan 1, 1978
3.781
+0.218
6.11%
jan 1, 1979
4.177
+0.396
10.46%
jan 1, 1980
4.744
+0.566
13.56%
jan 1, 1981
3.981
-0.762
-16.07%
jan 1, 1982
3.599
-0.382
-9.59%
jan 1, 1983
3.523
-0.076
-2.12%
jan 1, 1984
3.672
+0.149
4.22%
jan 1, 1985
2.89
-0.782
-21.3%
jan 1, 1986
2.927
+0.037
1.28%
jan 1, 1987
2.879
-0.048
-1.64%
jan 1, 1988
3.34
+0.461
16.02%
jan 1, 1989
4.102
+0.762
22.82%
jan 1, 1990
4.403
+0.301
7.33%
jan 1, 1991
3.648
-0.755
-17.14%
jan 1, 1992
3.437
-0.211
-5.8%
jan 1, 1993
3.338
-0.099
-2.88%
jan 1, 1994
3.495
+0.158
4.73%
jan 1, 1995
3.143
-0.352
-10.08%
jan 1, 1996
3.282
+0.139
4.43%
jan 1, 1997
3.189
-0.093
-2.84%
jan 1, 1998
3.268
+0.078
2.46%
jan 1, 1999
2.964
-0.303
-9.28%
jan 1, 2000
3.28
+0.316
10.65%
jan 1, 2001
3.036
-0.245
-7.46%
jan 1, 2002
3.03
-0.006
-0.2%
jan 1, 2003
2.898
-0.132
-4.36%
jan 1, 2004
2.931
+0.034
1.16%
jan 1, 2005
3.739
+0.808
27.56%
jan 1, 2006
3.768
+0.029
0.77%
jan 1, 2007
4.638
+0.87
23.08%
jan 1, 2008
5.566
+0.928
20.01%
jan 1, 2009
5.305
-0.261
-4.69%
jan 1, 2010
4.459
-0.846
-15.94%
jan 1, 2011
5.233
+0.774
17.36%
jan 1, 2012
5.739
+0.506
9.67%
jan 1, 2013
5.05
-0.689
-12.0%
jan 1, 2014
5.951
+0.901
17.84%
jan 1, 2015
5.503
-0.449
-7.54%
jan 1, 2016
5.679
+0.176
3.2%
Ranking of countries by current statistics by years


Comments: