29
/
en
AIzaSyAYiBZKx7MnpbEhh9jyipgxe19OcubqV5w
April 1, 2024
31485
Europe & Central Asia (excluding high income)
ECA
false
2
1
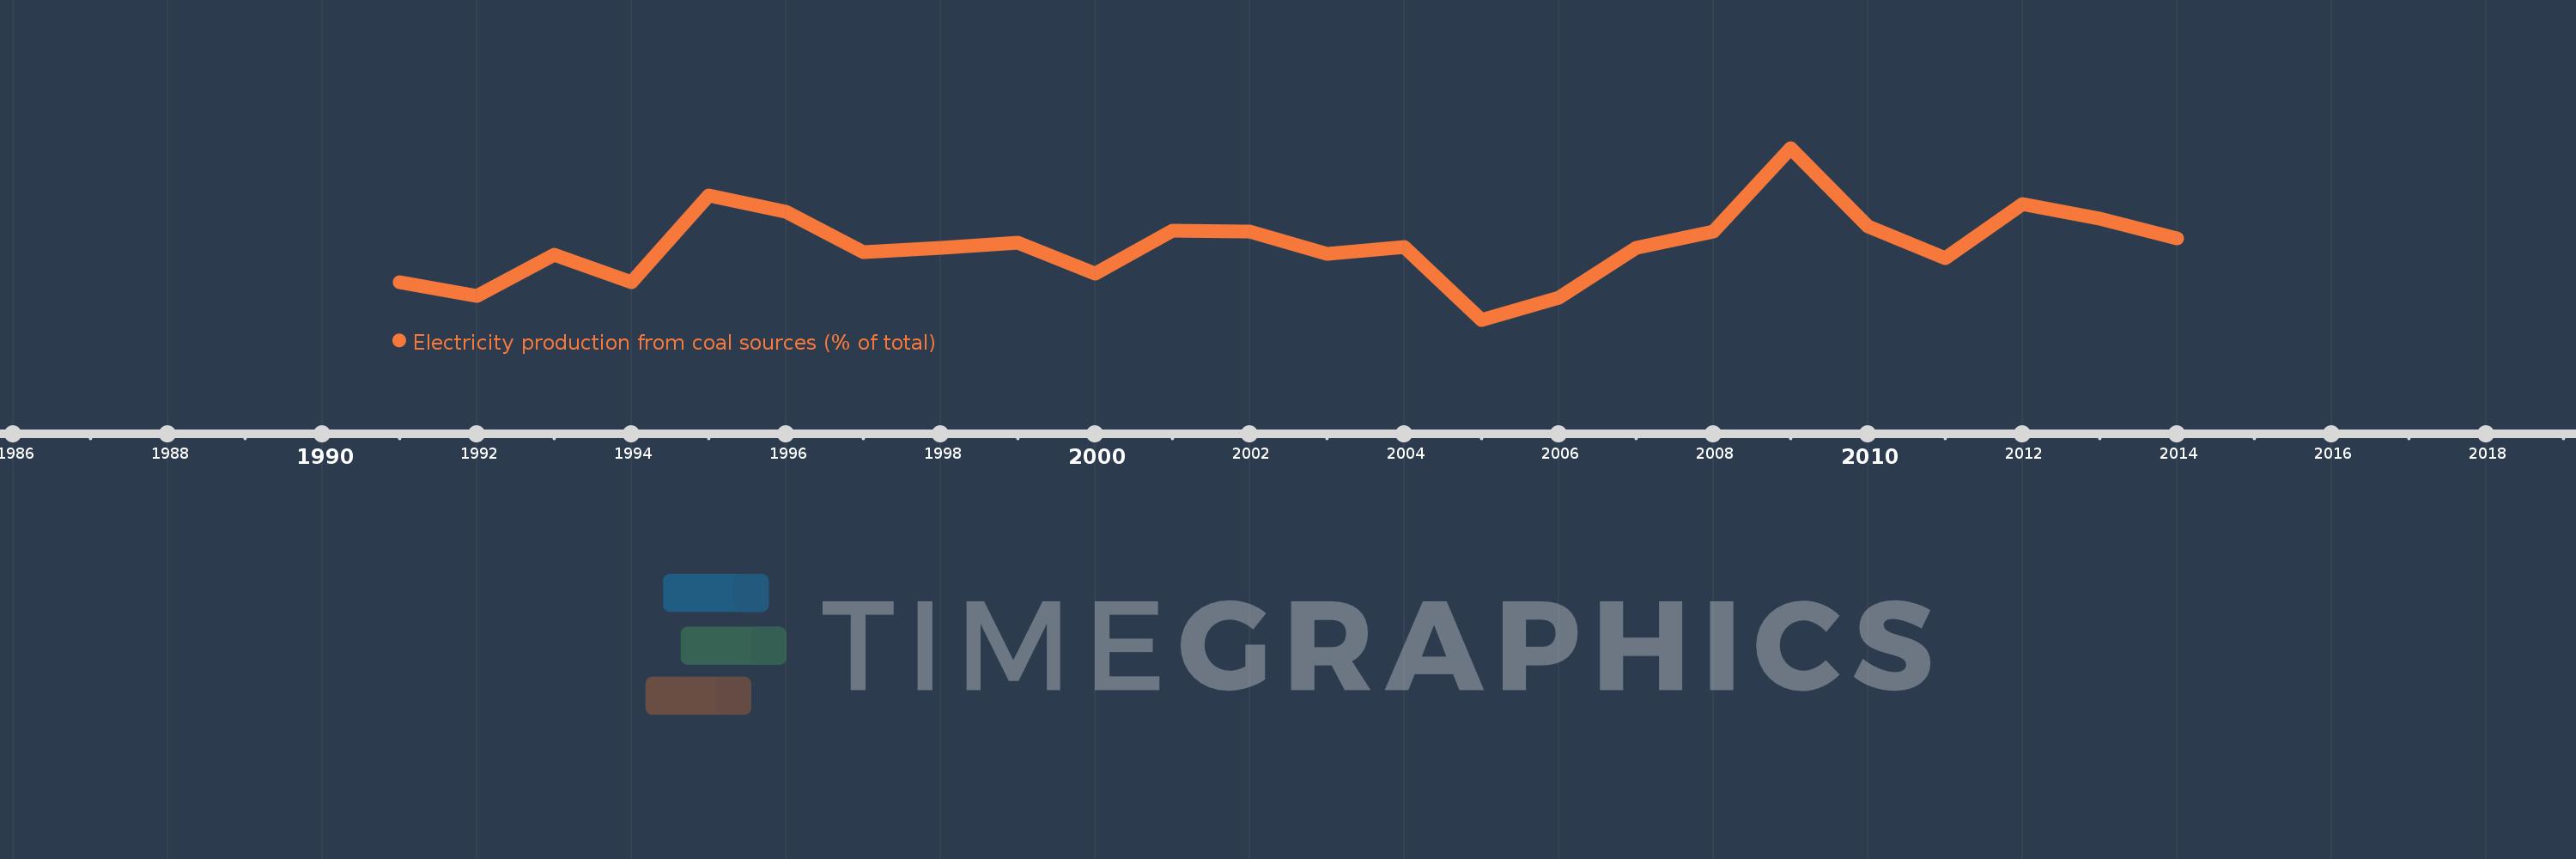
Electricity production from coal sources (% of total)
2014,2013,2012,2011,2010,2009,2008,2007,2006,2005,2004,2003,2002,2001,2000,1999,1998,1997,1996,1995,1994,1993,1992,1991
This statistics in other country:
AlbaniaAlgeriaAngolaArab WorldArgentinaArmeniaAustraliaAustriaAzerbaijanBahrainBangladeshBelarusBelgiumBeninBoliviaBosnia and HerzegovinaBotswanaBrazilBrunei DarussalamBulgariaCambodiaCameroonCanadaCentral Europe and the BalticsChileChinaColombiaCongo, Dem. Rep.Congo, Rep.Costa RicaCote d'IvoireCroatiaCubaCuracaoCyprusCzech RepublicDenmarkDominican RepublicEarly-demographic dividendEast Asia & PacificEast Asia & Pacific (excluding high income)East Asia & Pacific (IDA & IBRD countries)EcuadorEgypt, Arab Rep.El SalvadorEritreaEstoniaEthiopiaEuro areaEurope & Central AsiaEurope & Central Asia (excluding high income)Europe & Central Asia (IDA & IBRD countries)European UnionFinlandFragile and conflict affected situationsFranceGabonGeorgiaGermanyGhanaGibraltarGreeceGuatemalaHaitiHeavily indebted poor countries (HIPC)High incomeHondurasHong Kong SAR, ChinaHungaryIBRD onlyIcelandIDA & IBRD totalIDA blendIDA onlyIDA totalIndiaIndonesiaIran, Islamic Rep.IraqIrelandIsraelItalyJamaicaJapanJordanKazakhstanKenyaKorea, Dem. People’s Rep.Korea, Rep.KosovoKuwaitKyrgyz RepublicLate-demographic dividendLatin America & Caribbean Latin America & Caribbean (excluding high income)Latin America & the Caribbean (IDA & IBRD countries)LatviaLeast developed countries: UN classificationLebanonLibyaLithuaniaLow & middle incomeLower middle incomeLuxembourgMacedonia, FYRMalaysiaMaltaMauritiusMexicoMiddle East & North AfricaMiddle East & North Africa (excluding high income)Middle East & North Africa (IDA & IBRD countries)Middle incomeMoldovaMongoliaMontenegroMoroccoMozambiqueMyanmarNamibiaNepalNetherlandsNew ZealandNicaraguaNigerNigeriaNorth AmericaNorwayOECD membersOmanOther small statesPakistanPanamaParaguayPeruPhilippinesPolandPortugalPost-demographic dividendPre-demographic dividendQatarRomaniaRussian FederationSaudi ArabiaSenegalSerbiaSingaporeSlovak RepublicSloveniaSmall statesSouth AfricaSouth AsiaSouth Asia (IDA & IBRD)South SudanSpainSri LankaSub-Saharan Africa Sub-Saharan Africa (excluding high income)Sub-Saharan Africa (IDA & IBRD countries)SudanSwedenSwitzerlandSyrian Arab RepublicTajikistanTanzaniaThailandTogoTrinidad and TobagoTunisiaTurkeyTurkmenistanUkraineUnited Arab EmiratesUnited KingdomUnited StatesUpper middle incomeUruguayUzbekistanVenezuela, RBVietnamWorldYemen, Rep.ZambiaZimbabwe Timeline:
This timeline shows a graph from 1991 to 2014 of Europe & Central Asia (excluding high income). No data until 1990. Number of actual observations by date: 24.
Source name:
World Development Indicators
Source organization:
IEA Statistics © OECD/IEA 2014 (http://www.iea.org/stats/index.asp), subject to https://www.iea.org/t&c/termsandconditions/
Categories, topics:
Energy & Mining, Climate Change, Infrastructure
Last updated:
apr 23, 2017
Indicators value changes by year
Minimum:
22.553
jan 1, 2005
Maximum:
26.202
jan 1, 2009
At the date of observation
Value
Absolute change
Change from previous value
jan 1, 1991
23.348
+23.348
0.0%
jan 1, 1992
23.052
-0.297
-1.27%
jan 1, 1993
23.927
+0.876
3.8%
jan 1, 1994
23.342
-0.586
-2.45%
jan 1, 1995
25.196
+1.854
7.94%
jan 1, 1996
24.852
-0.344
-1.37%
jan 1, 1997
23.989
-0.863
-3.47%
jan 1, 1998
24.085
+0.096
0.4%
jan 1, 1999
24.187
+0.102
0.42%
jan 1, 2000
23.541
-0.646
-2.67%
jan 1, 2001
24.453
+0.912
3.87%
jan 1, 2002
24.431
-0.022
-0.09%
jan 1, 2003
23.945
-0.486
-1.99%
jan 1, 2004
24.105
+0.161
0.67%
jan 1, 2005
22.553
-1.552
-6.44%
jan 1, 2006
23.016
+0.463
2.05%
jan 1, 2007
24.084
+1.068
4.64%
jan 1, 2008
24.435
+0.351
1.46%
jan 1, 2009
26.202
+1.767
7.23%
jan 1, 2010
24.53
-1.672
-6.38%
jan 1, 2011
23.867
-0.664
-2.71%
jan 1, 2012
25.011
+1.144
4.79%
jan 1, 2013
24.709
-0.302
-1.21%
jan 1, 2014
24.273
-0.436
-1.77%
Ranking of countries by current statistics by years


Comments: