29
/
en
AIzaSyAYiBZKx7MnpbEhh9jyipgxe19OcubqV5w
April 1, 2024
118803
Denmark
DNK
true
2
1
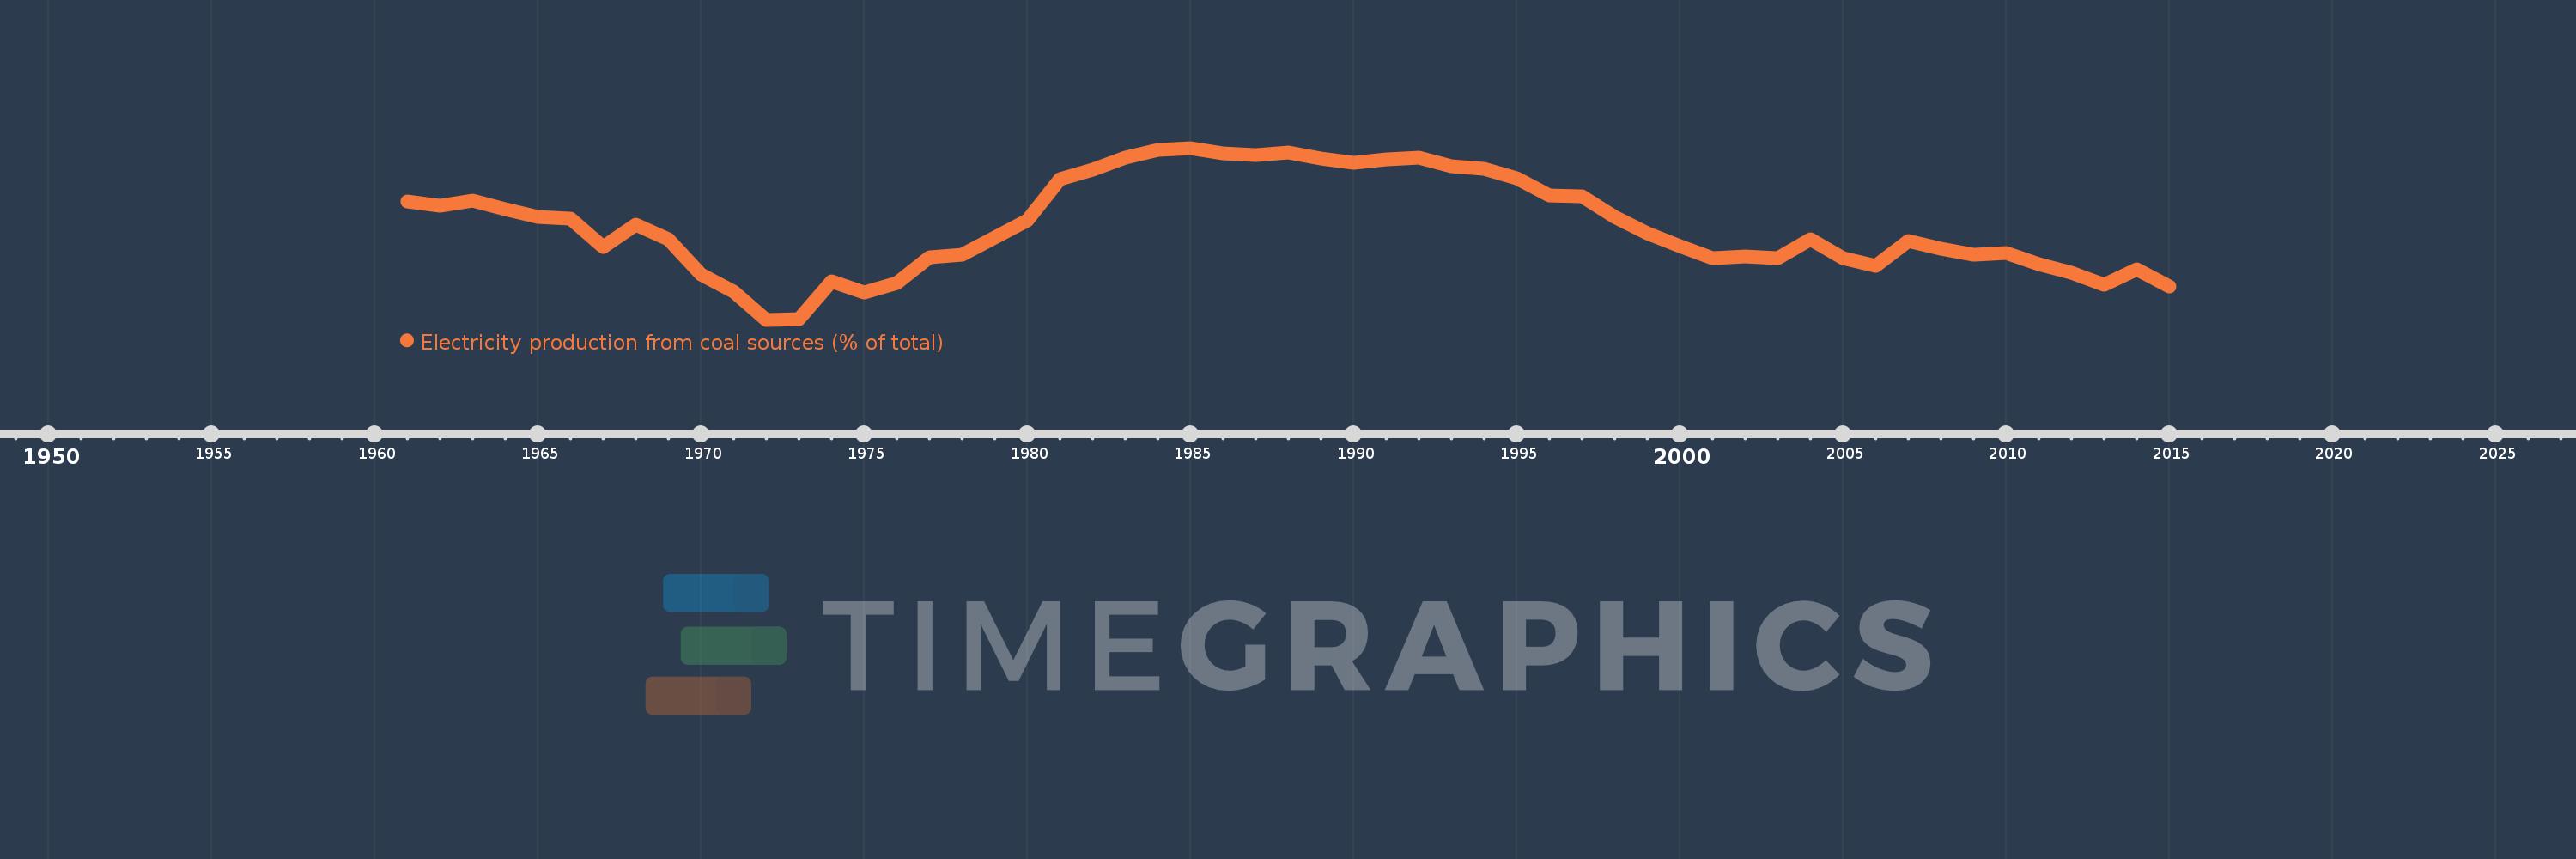
Electricity production from coal sources (% of total)
2015,2014,2013,2012,2011,2010,2009,2008,2007,2006,2005,2004,2003,2002,2001,2000,1999,1998,1997,1996,1995,1994,1993,1992,1991,1990,1989,1988,1987,1986,1985,1984,1983,1982,1981,1980,1979,1978,1977,1976,1975,1974,1973,1972,1971,1970,1969,1968,1967,1966,1965,1964,1963,1962,1961
This statistics in other country:
AlbaniaAlgeriaAngolaArab WorldArgentinaArmeniaAustraliaAustriaAzerbaijanBahrainBangladeshBelarusBelgiumBeninBoliviaBosnia and HerzegovinaBotswanaBrazilBrunei DarussalamBulgariaCambodiaCameroonCanadaCentral Europe and the BalticsChileChinaColombiaCongo, Dem. Rep.Congo, Rep.Costa RicaCote d'IvoireCroatiaCubaCuracaoCyprusCzech RepublicDenmarkDominican RepublicEarly-demographic dividendEast Asia & PacificEast Asia & Pacific (excluding high income)East Asia & Pacific (IDA & IBRD countries)EcuadorEgypt, Arab Rep.El SalvadorEritreaEstoniaEthiopiaEuro areaEurope & Central AsiaEurope & Central Asia (excluding high income)Europe & Central Asia (IDA & IBRD countries)European UnionFinlandFragile and conflict affected situationsFranceGabonGeorgiaGermanyGhanaGibraltarGreeceGuatemalaHaitiHeavily indebted poor countries (HIPC)High incomeHondurasHong Kong SAR, ChinaHungaryIBRD onlyIcelandIDA & IBRD totalIDA blendIDA onlyIDA totalIndiaIndonesiaIran, Islamic Rep.IraqIrelandIsraelItalyJamaicaJapanJordanKazakhstanKenyaKorea, Dem. People’s Rep.Korea, Rep.KosovoKuwaitKyrgyz RepublicLate-demographic dividendLatin America & Caribbean Latin America & Caribbean (excluding high income)Latin America & the Caribbean (IDA & IBRD countries)LatviaLeast developed countries: UN classificationLebanonLibyaLithuaniaLow & middle incomeLower middle incomeLuxembourgMacedonia, FYRMalaysiaMaltaMauritiusMexicoMiddle East & North AfricaMiddle East & North Africa (excluding high income)Middle East & North Africa (IDA & IBRD countries)Middle incomeMoldovaMongoliaMontenegroMoroccoMozambiqueMyanmarNamibiaNepalNetherlandsNew ZealandNicaraguaNigerNigeriaNorth AmericaNorwayOECD membersOmanOther small statesPakistanPanamaParaguayPeruPhilippinesPolandPortugalPost-demographic dividendPre-demographic dividendQatarRomaniaRussian FederationSaudi ArabiaSenegalSerbiaSingaporeSlovak RepublicSloveniaSmall statesSouth AfricaSouth AsiaSouth Asia (IDA & IBRD)South SudanSpainSri LankaSub-Saharan Africa Sub-Saharan Africa (excluding high income)Sub-Saharan Africa (IDA & IBRD countries)SudanSwedenSwitzerlandSyrian Arab RepublicTajikistanTanzaniaThailandTogoTrinidad and TobagoTunisiaTurkeyTurkmenistanUkraineUnited Arab EmiratesUnited KingdomUnited StatesUpper middle incomeUruguayUzbekistanVenezuela, RBVietnamWorldYemen, Rep.ZambiaZimbabwe Timeline:
This timeline shows a graph from 1961 to 2015 of Denmark. No data until 1960. Number of actual observations by date: 55.
Source name:
World Development Indicators
Source organization:
IEA Statistics © OECD/IEA 2014 (http://www.iea.org/stats/index.asp), subject to https://www.iea.org/t&c/termsandconditions/
Categories, topics:
Energy & Mining, Climate Change, Infrastructure
Last updated:
apr 23, 2017
Indicators value changes by year
Minimum:
18.594
jan 1, 1972
Maximum:
95.832
jan 1, 1985
At the date of observation
Value
Absolute change
Change from previous value
jan 1, 1961
71.625
+71.625
0.0%
jan 1, 1962
69.865
-1.76
-2.46%
jan 1, 1963
72.3
+2.436
3.49%
jan 1, 1964
68.161
-4.14
-5.73%
jan 1, 1965
64.837
-3.324
-4.88%
jan 1, 1966
63.973
-0.864
-1.33%
jan 1, 1967
51.411
-12.562
-19.64%
jan 1, 1968
61.438
+10.027
19.5%
jan 1, 1969
54.729
-6.709
-10.92%
jan 1, 1970
38.779
-15.95
-29.14%
jan 1, 1971
31.208
-7.571
-19.52%
jan 1, 1972
18.594
-12.613
-40.42%
jan 1, 1973
18.752
+0.158
0.85%
jan 1, 1974
35.8
+17.048
90.92%
jan 1, 1975
30.853
-4.947
-13.82%
jan 1, 1976
34.949
+4.096
13.27%
jan 1, 1977
46.477
+11.529
32.99%
jan 1, 1978
48.015
+1.538
3.31%
jan 1, 1979
55.392
+7.377
15.36%
jan 1, 1980
63.118
+7.726
13.95%
jan 1, 1981
81.842
+18.724
29.67%
jan 1, 1982
85.994
+4.152
5.07%
jan 1, 1983
91.452
+5.458
6.35%
jan 1, 1984
94.982
+3.529
3.86%
jan 1, 1985
95.832
+0.85
0.9%
jan 1, 1986
93.563
-2.269
-2.37%
jan 1, 1987
92.515
-1.048
-1.12%
jan 1, 1988
93.828
+1.313
1.42%
jan 1, 1989
91.087
-2.742
-2.92%
jan 1, 1990
89.086
-2.001
-2.2%
jan 1, 1991
90.67
+1.585
1.78%
jan 1, 1992
91.517
+0.847
0.93%
jan 1, 1993
87.699
-3.818
-4.17%
jan 1, 1994
86.322
-1.377
-1.57%
jan 1, 1995
82.04
-4.282
-4.96%
jan 1, 1996
74.422
-7.618
-9.29%
jan 1, 1997
74.027
-0.395
-0.53%
jan 1, 1998
64.89
-9.137
-12.34%
jan 1, 1999
57.532
-7.358
-11.34%
jan 1, 2000
51.596
-5.936
-10.32%
jan 1, 2001
46.246
-5.35
-10.37%
jan 1, 2002
47.229
+0.983
2.13%
jan 1, 2003
46.471
-0.758
-1.61%
jan 1, 2004
54.794
+8.323
17.91%
jan 1, 2005
46.179
-8.615
-15.72%
jan 1, 2006
42.661
-3.518
-7.62%
jan 1, 2007
53.86
+11.199
26.25%
jan 1, 2008
50.593
-3.267
-6.07%
jan 1, 2009
47.69
-2.903
-5.74%
jan 1, 2010
48.613
+0.924
1.94%
jan 1, 2011
43.76
-4.853
-9.98%
jan 1, 2012
39.672
-4.088
-9.34%
jan 1, 2013
34.382
-5.289
-13.33%
jan 1, 2014
41.129
+6.747
19.62%
jan 1, 2015
33.709
-7.42
-18.04%
Ranking of countries by current statistics by years


Comments: