29
/
en
AIzaSyAYiBZKx7MnpbEhh9jyipgxe19OcubqV5w
April 1, 2024
107118
Colombia
COL
true
2
1
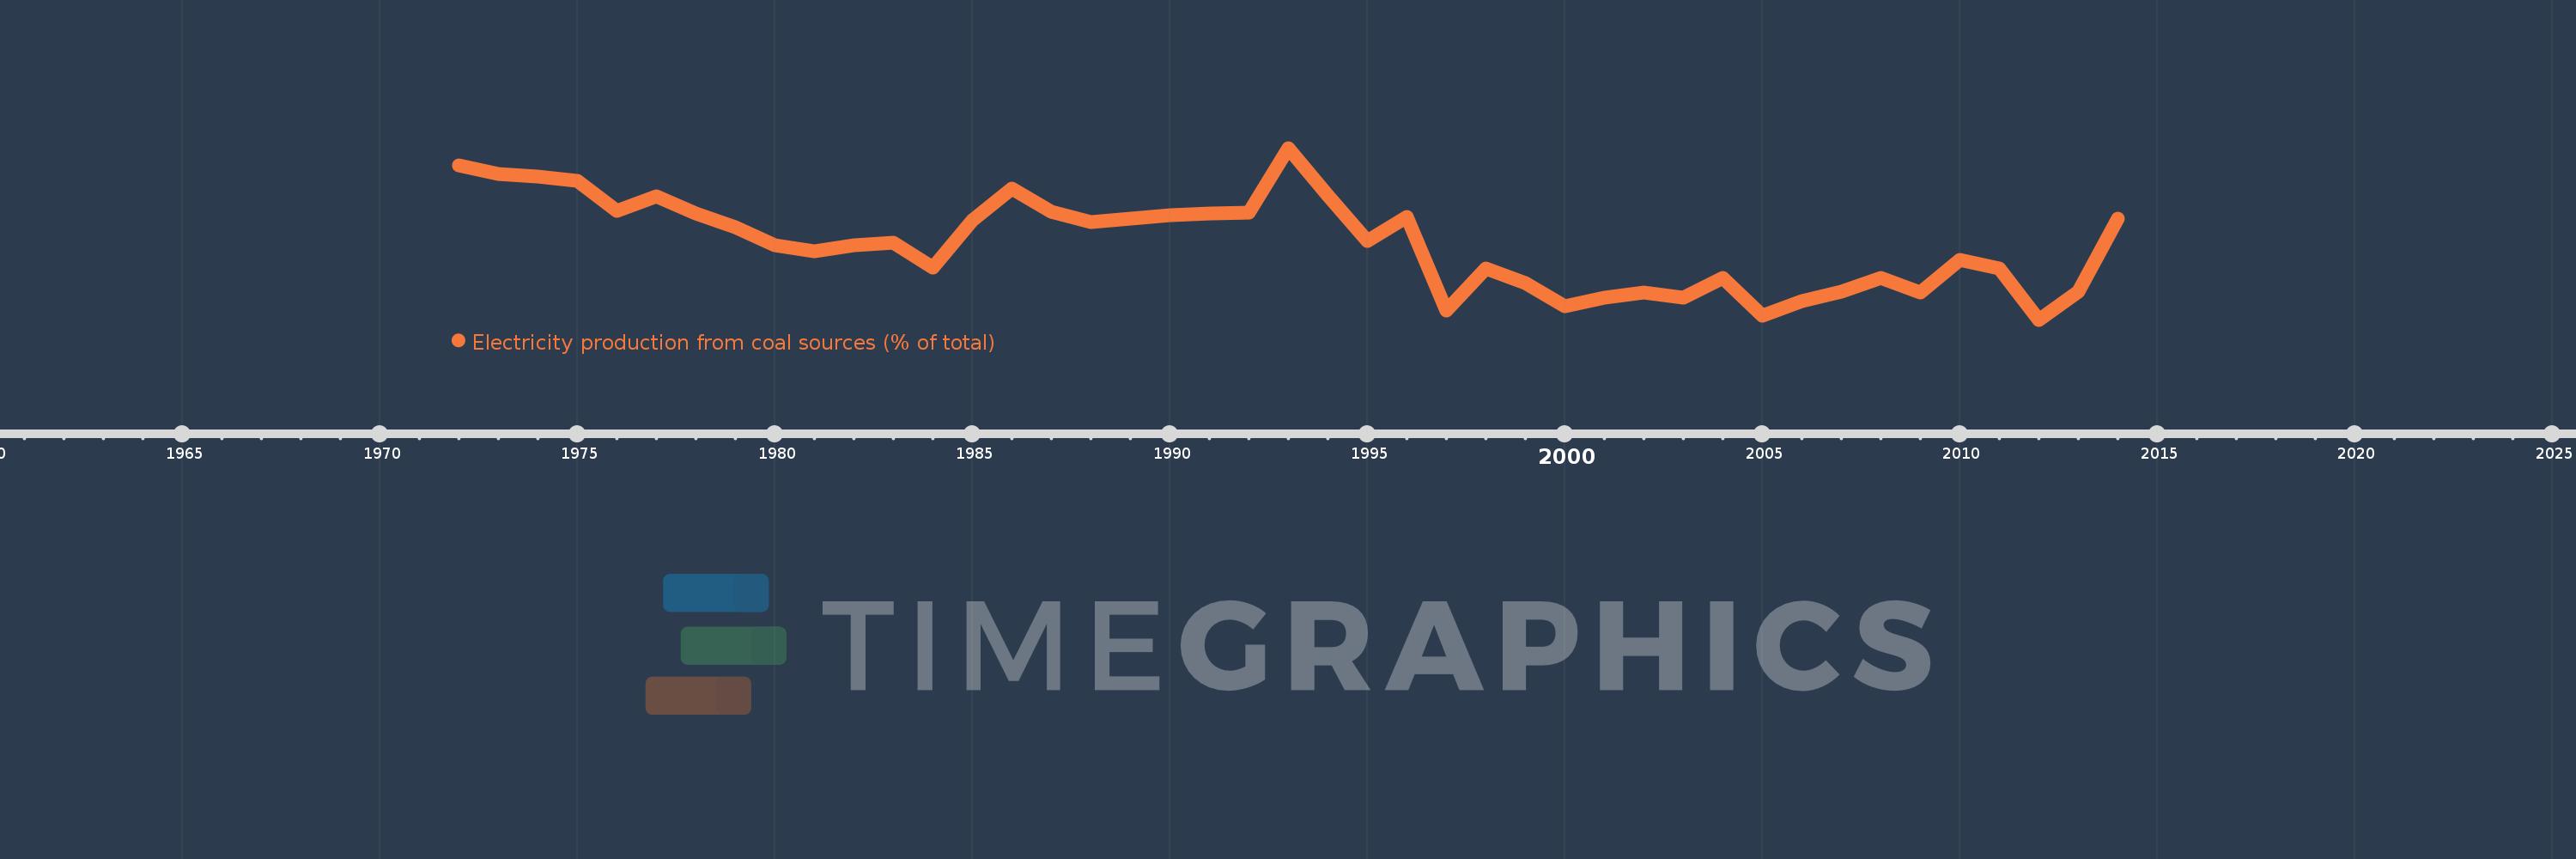
Electricity production from coal sources (% of total)
2014,2013,2012,2011,2010,2009,2008,2007,2006,2005,2004,2003,2002,2001,2000,1999,1998,1997,1996,1995,1994,1993,1992,1991,1990,1989,1988,1987,1986,1985,1984,1983,1982,1981,1980,1979,1978,1977,1976,1975,1974,1973,1972
This statistics in other country:
AlbaniaAlgeriaAngolaArab WorldArgentinaArmeniaAustraliaAustriaAzerbaijanBahrainBangladeshBelarusBelgiumBeninBoliviaBosnia and HerzegovinaBotswanaBrazilBrunei DarussalamBulgariaCambodiaCameroonCanadaCentral Europe and the BalticsChileChinaColombiaCongo, Dem. Rep.Congo, Rep.Costa RicaCote d'IvoireCroatiaCubaCuracaoCyprusCzech RepublicDenmarkDominican RepublicEarly-demographic dividendEast Asia & PacificEast Asia & Pacific (excluding high income)East Asia & Pacific (IDA & IBRD countries)EcuadorEgypt, Arab Rep.El SalvadorEritreaEstoniaEthiopiaEuro areaEurope & Central AsiaEurope & Central Asia (excluding high income)Europe & Central Asia (IDA & IBRD countries)European UnionFinlandFragile and conflict affected situationsFranceGabonGeorgiaGermanyGhanaGibraltarGreeceGuatemalaHaitiHeavily indebted poor countries (HIPC)High incomeHondurasHong Kong SAR, ChinaHungaryIBRD onlyIcelandIDA & IBRD totalIDA blendIDA onlyIDA totalIndiaIndonesiaIran, Islamic Rep.IraqIrelandIsraelItalyJamaicaJapanJordanKazakhstanKenyaKorea, Dem. People’s Rep.Korea, Rep.KosovoKuwaitKyrgyz RepublicLate-demographic dividendLatin America & Caribbean Latin America & Caribbean (excluding high income)Latin America & the Caribbean (IDA & IBRD countries)LatviaLeast developed countries: UN classificationLebanonLibyaLithuaniaLow & middle incomeLower middle incomeLuxembourgMacedonia, FYRMalaysiaMaltaMauritiusMexicoMiddle East & North AfricaMiddle East & North Africa (excluding high income)Middle East & North Africa (IDA & IBRD countries)Middle incomeMoldovaMongoliaMontenegroMoroccoMozambiqueMyanmarNamibiaNepalNetherlandsNew ZealandNicaraguaNigerNigeriaNorth AmericaNorwayOECD membersOmanOther small statesPakistanPanamaParaguayPeruPhilippinesPolandPortugalPost-demographic dividendPre-demographic dividendQatarRomaniaRussian FederationSaudi ArabiaSenegalSerbiaSingaporeSlovak RepublicSloveniaSmall statesSouth AfricaSouth AsiaSouth Asia (IDA & IBRD)South SudanSpainSri LankaSub-Saharan Africa Sub-Saharan Africa (excluding high income)Sub-Saharan Africa (IDA & IBRD countries)SudanSwedenSwitzerlandSyrian Arab RepublicTajikistanTanzaniaThailandTogoTrinidad and TobagoTunisiaTurkeyTurkmenistanUkraineUnited Arab EmiratesUnited KingdomUnited StatesUpper middle incomeUruguayUzbekistanVenezuela, RBVietnamWorldYemen, Rep.ZambiaZimbabwe Timeline:
This timeline shows a graph from 1972 to 2014 of Colombia. No data until 1971. Number of actual observations by date: 43.
Source name:
World Development Indicators
Source organization:
IEA Statistics © OECD/IEA 2014 (http://www.iea.org/stats/index.asp), subject to https://www.iea.org/t&c/termsandconditions/
Categories, topics:
Energy & Mining, Climate Change, Infrastructure
Last updated:
apr 23, 2017
Indicators value changes by year
Maximum:
14.173
jan 1, 1993
At the date of observation
Value
Absolute change
Change from previous value
jan 1, 1972
13.114
+13.114
0.0%
jan 1, 1973
12.587
-0.527
-4.02%
jan 1, 1974
12.445
-0.142
-1.12%
jan 1, 1975
12.195
-0.251
-2.01%
jan 1, 1976
10.37
-1.824
-14.96%
jan 1, 1977
11.243
+0.873
8.42%
jan 1, 1978
10.205
-1.038
-9.23%
jan 1, 1979
9.353
-0.852
-8.35%
jan 1, 1980
8.287
-1.066
-11.4%
jan 1, 1981
7.909
-0.379
-4.57%
jan 1, 1982
8.293
+0.384
4.86%
jan 1, 1983
8.412
+0.119
1.44%
jan 1, 1984
6.937
-1.475
-17.53%
jan 1, 1985
9.785
+2.848
41.05%
jan 1, 1986
11.701
+1.916
19.58%
jan 1, 1987
10.292
-1.409
-12.04%
jan 1, 1988
9.703
-0.59
-5.73%
jan 1, 1989
9.893
+0.191
1.97%
jan 1, 1990
10.092
+0.198
2.0%
jan 1, 1991
10.199
+0.107
1.06%
jan 1, 1992
10.281
+0.082
0.81%
jan 1, 1993
14.173
+3.891
37.85%
jan 1, 1994
11.281
-2.891
-20.4%
jan 1, 1995
8.551
-2.73
-24.2%
jan 1, 1996
10.003
+1.452
16.98%
jan 1, 1997
4.319
-5.684
-56.82%
jan 1, 1998
6.867
+2.547
58.98%
jan 1, 1999
5.967
-0.9
-13.11%
jan 1, 2000
4.565
-1.402
-23.49%
jan 1, 2001
5.104
+0.538
11.79%
jan 1, 2002
5.437
+0.333
6.53%
jan 1, 2003
5.124
-0.313
-5.76%
jan 1, 2004
6.291
+1.167
22.78%
jan 1, 2005
4.015
-2.277
-36.19%
jan 1, 2006
4.905
+0.89
22.18%
jan 1, 2007
5.459
+0.554
11.29%
jan 1, 2008
6.298
+0.839
15.37%
jan 1, 2009
5.413
-0.885
-14.05%
jan 1, 2010
7.412
+1.999
36.93%
jan 1, 2011
6.891
-0.521
-7.03%
jan 1, 2012
3.77
-3.121
-45.29%
jan 1, 2013
5.472
+1.702
45.14%
jan 1, 2014
9.874
+4.402
80.45%
Ranking of countries by current statistics by years


Comments: