29
/
en
AIzaSyAYiBZKx7MnpbEhh9jyipgxe19OcubqV5w
April 1, 2024
38069
IDA blend
IDB
false
2
1
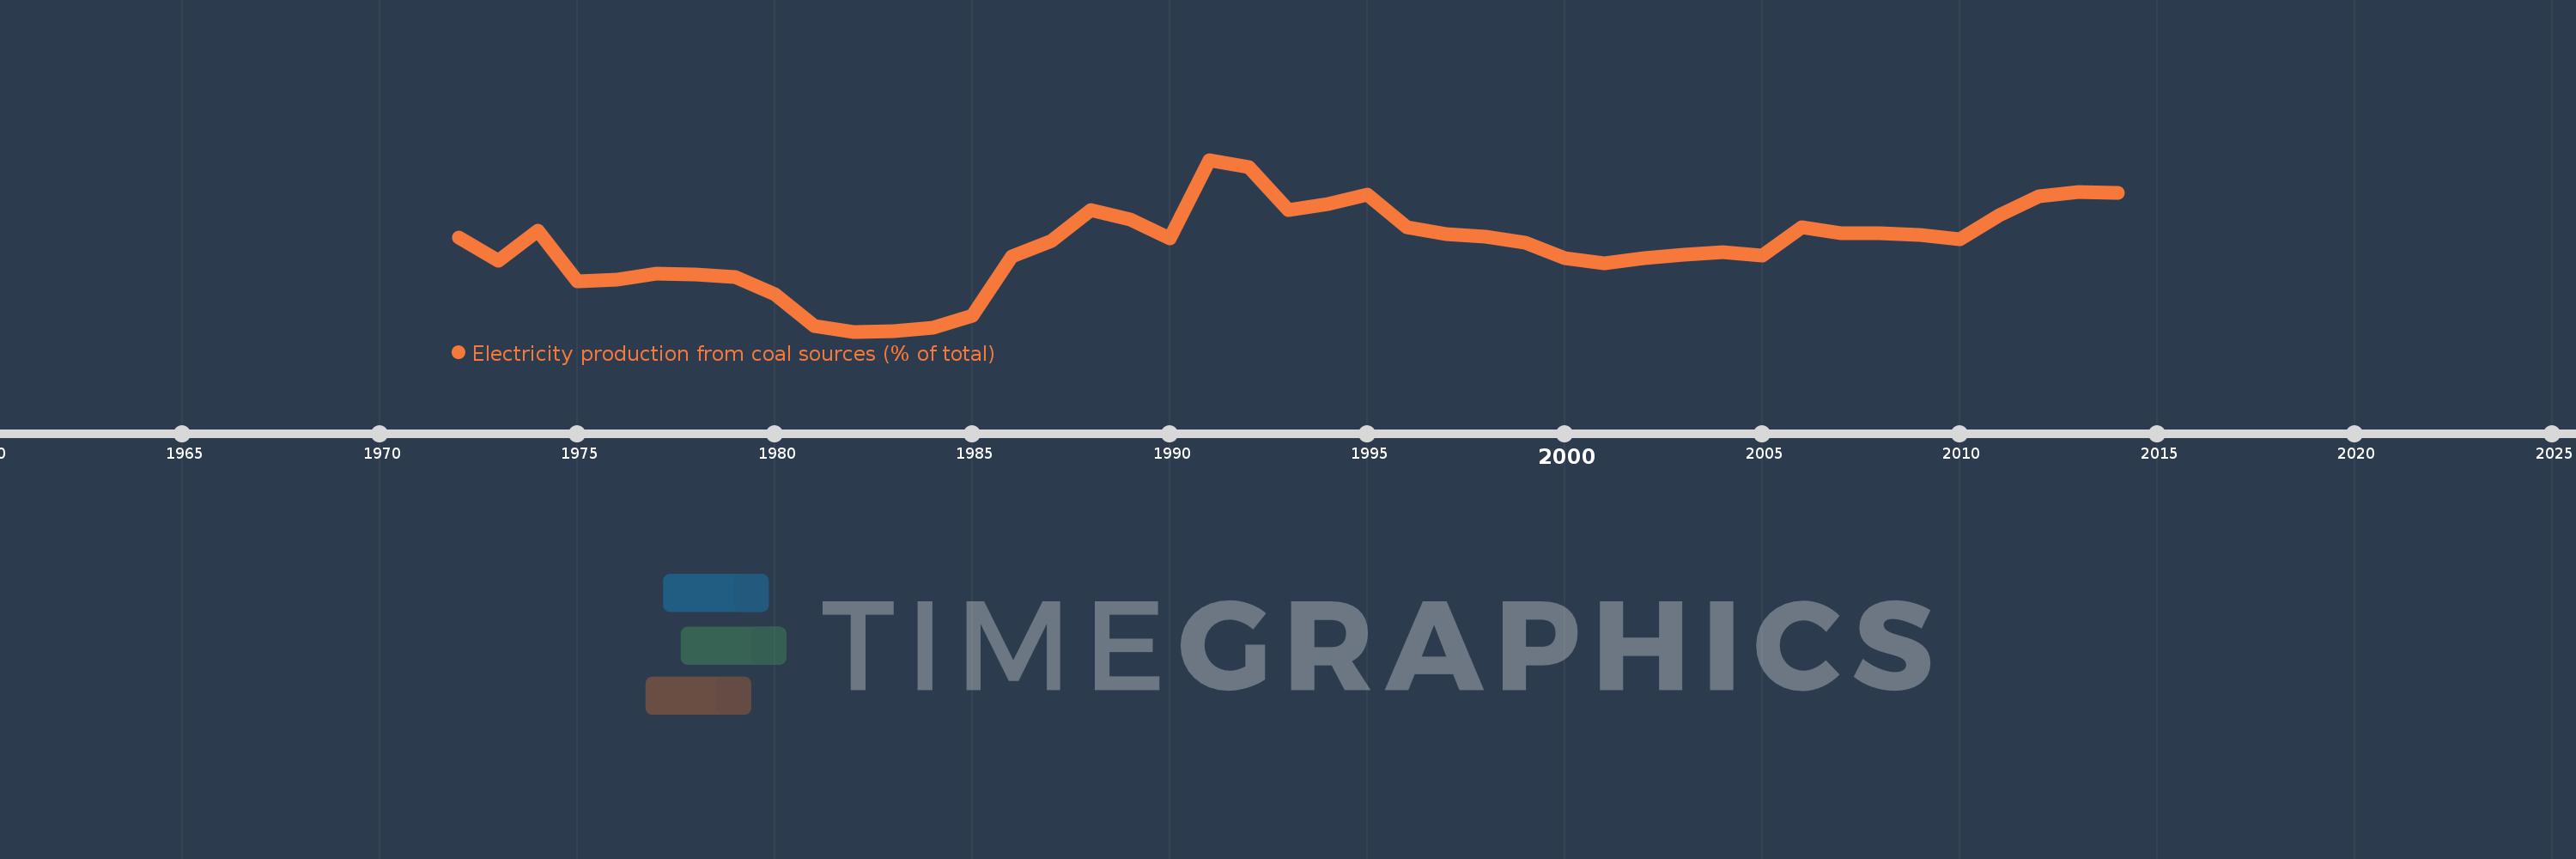
Electricity production from coal sources (% of total)
2014,2013,2012,2011,2010,2009,2008,2007,2006,2005,2004,2003,2002,2001,2000,1999,1998,1997,1996,1995,1994,1993,1992,1991,1990,1989,1988,1987,1986,1985,1984,1983,1982,1981,1980,1979,1978,1977,1976,1975,1974,1973,1972
This statistics in other country:
AlbaniaAlgeriaAngolaArab WorldArgentinaArmeniaAustraliaAustriaAzerbaijanBahrainBangladeshBelarusBelgiumBeninBoliviaBosnia and HerzegovinaBotswanaBrazilBrunei DarussalamBulgariaCambodiaCameroonCanadaCentral Europe and the BalticsChileChinaColombiaCongo, Dem. Rep.Congo, Rep.Costa RicaCote d'IvoireCroatiaCubaCuracaoCyprusCzech RepublicDenmarkDominican RepublicEarly-demographic dividendEast Asia & PacificEast Asia & Pacific (excluding high income)East Asia & Pacific (IDA & IBRD countries)EcuadorEgypt, Arab Rep.El SalvadorEritreaEstoniaEthiopiaEuro areaEurope & Central AsiaEurope & Central Asia (excluding high income)Europe & Central Asia (IDA & IBRD countries)European UnionFinlandFragile and conflict affected situationsFranceGabonGeorgiaGermanyGhanaGibraltarGreeceGuatemalaHaitiHeavily indebted poor countries (HIPC)High incomeHondurasHong Kong SAR, ChinaHungaryIBRD onlyIcelandIDA & IBRD totalIDA blendIDA onlyIDA totalIndiaIndonesiaIran, Islamic Rep.IraqIrelandIsraelItalyJamaicaJapanJordanKazakhstanKenyaKorea, Dem. People’s Rep.Korea, Rep.KosovoKuwaitKyrgyz RepublicLate-demographic dividendLatin America & Caribbean Latin America & Caribbean (excluding high income)Latin America & the Caribbean (IDA & IBRD countries)LatviaLeast developed countries: UN classificationLebanonLibyaLithuaniaLow & middle incomeLower middle incomeLuxembourgMacedonia, FYRMalaysiaMaltaMauritiusMexicoMiddle East & North AfricaMiddle East & North Africa (excluding high income)Middle East & North Africa (IDA & IBRD countries)Middle incomeMoldovaMongoliaMontenegroMoroccoMozambiqueMyanmarNamibiaNepalNetherlandsNew ZealandNicaraguaNigerNigeriaNorth AmericaNorwayOECD membersOmanOther small statesPakistanPanamaParaguayPeruPhilippinesPolandPortugalPost-demographic dividendPre-demographic dividendQatarRomaniaRussian FederationSaudi ArabiaSenegalSerbiaSingaporeSlovak RepublicSloveniaSmall statesSouth AfricaSouth AsiaSouth Asia (IDA & IBRD)South SudanSpainSri LankaSub-Saharan Africa Sub-Saharan Africa (excluding high income)Sub-Saharan Africa (IDA & IBRD countries)SudanSwedenSwitzerlandSyrian Arab RepublicTajikistanTanzaniaThailandTogoTrinidad and TobagoTunisiaTurkeyTurkmenistanUkraineUnited Arab EmiratesUnited KingdomUnited StatesUpper middle incomeUruguayUzbekistanVenezuela, RBVietnamWorldYemen, Rep.ZambiaZimbabwe Timeline:
This timeline shows a graph from 1972 to 2014 of IDA blend. No data until 1971. Number of actual observations by date: 43.
Source name:
World Development Indicators
Source organization:
IEA Statistics © OECD/IEA 2014 (http://www.iea.org/stats/index.asp), subject to https://www.iea.org/t&c/termsandconditions/
Categories, topics:
Energy & Mining, Climate Change, Infrastructure
Last updated:
apr 23, 2017
Indicators value changes by year
Maximum:
12.246
jan 1, 1991
At the date of observation
Value
Absolute change
Change from previous value
jan 1, 1972
7.81
+7.81
0.0%
jan 1, 1973
6.493
-1.317
-16.87%
jan 1, 1974
8.187
+1.695
26.1%
jan 1, 1975
5.288
-2.899
-35.41%
jan 1, 1976
5.403
+0.115
2.18%
jan 1, 1977
5.759
+0.356
6.59%
jan 1, 1978
5.676
-0.084
-1.45%
jan 1, 1979
5.532
-0.144
-2.53%
jan 1, 1980
4.566
-0.966
-17.46%
jan 1, 1981
2.755
-1.811
-39.66%
jan 1, 1982
2.422
-0.333
-12.09%
jan 1, 1983
2.46
+0.038
1.56%
jan 1, 1984
2.64
+0.18
7.31%
jan 1, 1985
3.307
+0.667
25.27%
jan 1, 1986
6.697
+3.39
102.51%
jan 1, 1987
7.599
+0.902
13.47%
jan 1, 1988
9.368
+1.769
23.28%
jan 1, 1989
8.832
-0.536
-5.72%
jan 1, 1990
7.751
-1.081
-12.24%
jan 1, 1991
12.246
+4.495
57.99%
jan 1, 1992
11.834
-0.412
-3.36%
jan 1, 1993
9.383
-2.451
-20.71%
jan 1, 1994
9.733
+0.35
3.74%
jan 1, 1995
10.238
+0.505
5.19%
jan 1, 1996
8.373
-1.865
-18.22%
jan 1, 1997
7.99
-0.383
-4.57%
jan 1, 1998
7.842
-0.148
-1.86%
jan 1, 1999
7.499
-0.343
-4.37%
jan 1, 2000
6.642
-0.857
-11.43%
jan 1, 2001
6.31
-0.332
-5.0%
jan 1, 2002
6.619
+0.309
4.89%
jan 1, 2003
6.834
+0.215
3.25%
jan 1, 2004
6.984
+0.15
2.2%
jan 1, 2005
6.765
-0.219
-3.14%
jan 1, 2006
8.369
+1.604
23.71%
jan 1, 2007
8.048
-0.32
-3.83%
jan 1, 2008
8.027
-0.022
-0.27%
jan 1, 2009
7.971
-0.055
-0.69%
jan 1, 2010
7.718
-0.253
-3.18%
jan 1, 2011
9.056
+1.338
17.34%
jan 1, 2012
10.165
+1.108
12.24%
jan 1, 2013
10.416
+0.252
2.48%
jan 1, 2014
10.335
-0.082
-0.78%
Ranking of countries by current statistics by years


Comments: