29
/
en
AIzaSyAYiBZKx7MnpbEhh9jyipgxe19OcubqV5w
April 1, 2024
41357
Latin America & Caribbean
LCN
false
2
1
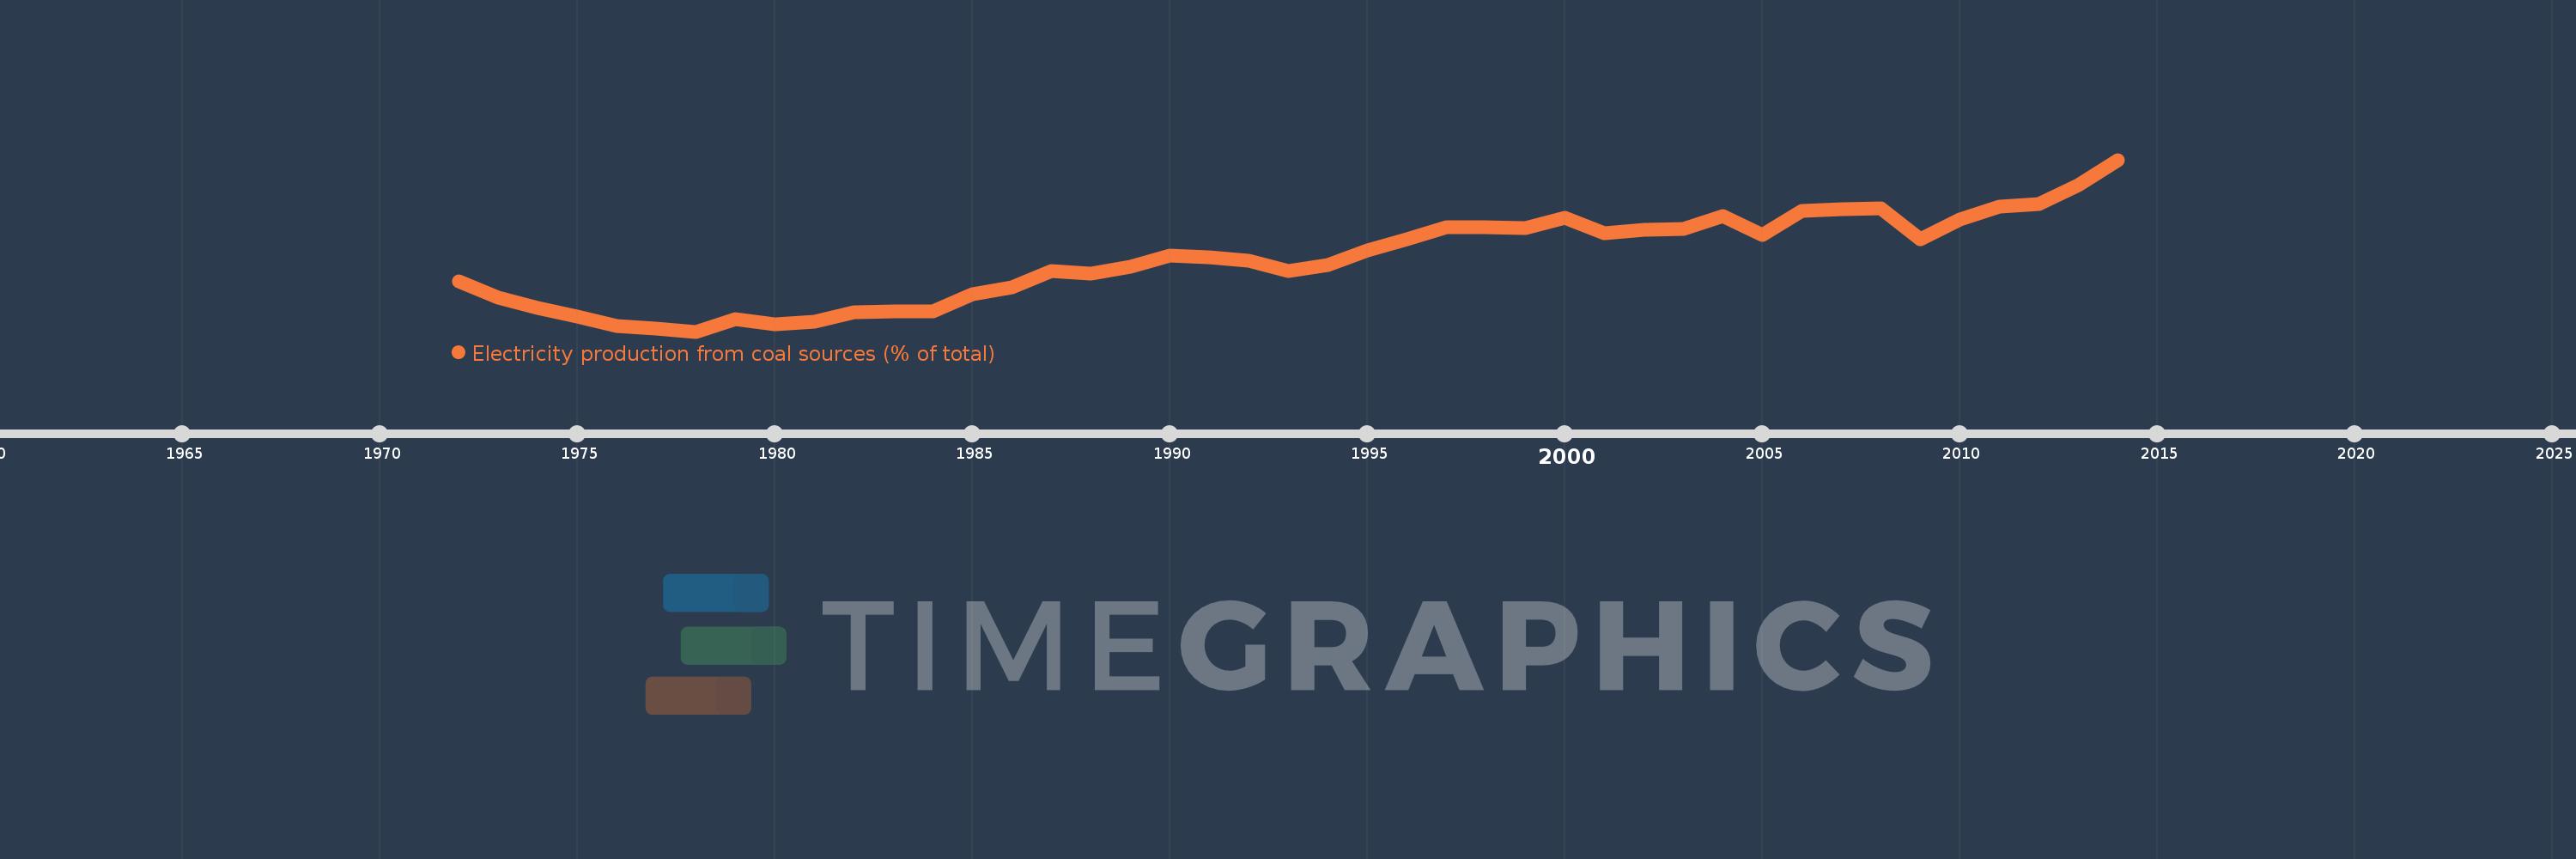
Electricity production from coal sources (% of total)
2014,2013,2012,2011,2010,2009,2008,2007,2006,2005,2004,2003,2002,2001,2000,1999,1998,1997,1996,1995,1994,1993,1992,1991,1990,1989,1988,1987,1986,1985,1984,1983,1982,1981,1980,1979,1978,1977,1976,1975,1974,1973,1972
This statistics in other country:
AlbaniaAlgeriaAngolaArab WorldArgentinaArmeniaAustraliaAustriaAzerbaijanBahrainBangladeshBelarusBelgiumBeninBoliviaBosnia and HerzegovinaBotswanaBrazilBrunei DarussalamBulgariaCambodiaCameroonCanadaCentral Europe and the BalticsChileChinaColombiaCongo, Dem. Rep.Congo, Rep.Costa RicaCote d'IvoireCroatiaCubaCuracaoCyprusCzech RepublicDenmarkDominican RepublicEarly-demographic dividendEast Asia & PacificEast Asia & Pacific (excluding high income)East Asia & Pacific (IDA & IBRD countries)EcuadorEgypt, Arab Rep.El SalvadorEritreaEstoniaEthiopiaEuro areaEurope & Central AsiaEurope & Central Asia (excluding high income)Europe & Central Asia (IDA & IBRD countries)European UnionFinlandFragile and conflict affected situationsFranceGabonGeorgiaGermanyGhanaGibraltarGreeceGuatemalaHaitiHeavily indebted poor countries (HIPC)High incomeHondurasHong Kong SAR, ChinaHungaryIBRD onlyIcelandIDA & IBRD totalIDA blendIDA onlyIDA totalIndiaIndonesiaIran, Islamic Rep.IraqIrelandIsraelItalyJamaicaJapanJordanKazakhstanKenyaKorea, Dem. People’s Rep.Korea, Rep.KosovoKuwaitKyrgyz RepublicLate-demographic dividendLatin America & Caribbean Latin America & Caribbean (excluding high income)Latin America & the Caribbean (IDA & IBRD countries)LatviaLeast developed countries: UN classificationLebanonLibyaLithuaniaLow & middle incomeLower middle incomeLuxembourgMacedonia, FYRMalaysiaMaltaMauritiusMexicoMiddle East & North AfricaMiddle East & North Africa (excluding high income)Middle East & North Africa (IDA & IBRD countries)Middle incomeMoldovaMongoliaMontenegroMoroccoMozambiqueMyanmarNamibiaNepalNetherlandsNew ZealandNicaraguaNigerNigeriaNorth AmericaNorwayOECD membersOmanOther small statesPakistanPanamaParaguayPeruPhilippinesPolandPortugalPost-demographic dividendPre-demographic dividendQatarRomaniaRussian FederationSaudi ArabiaSenegalSerbiaSingaporeSlovak RepublicSloveniaSmall statesSouth AfricaSouth AsiaSouth Asia (IDA & IBRD)South SudanSpainSri LankaSub-Saharan Africa Sub-Saharan Africa (excluding high income)Sub-Saharan Africa (IDA & IBRD countries)SudanSwedenSwitzerlandSyrian Arab RepublicTajikistanTanzaniaThailandTogoTrinidad and TobagoTunisiaTurkeyTurkmenistanUkraineUnited Arab EmiratesUnited KingdomUnited StatesUpper middle incomeUruguayUzbekistanVenezuela, RBVietnamWorldYemen, Rep.ZambiaZimbabwe Timeline:
This timeline shows a graph from 1972 to 2014 of Latin America & Caribbean . No data until 1971. Number of actual observations by date: 43.
Source name:
World Development Indicators
Source organization:
IEA Statistics © OECD/IEA 2014 (http://www.iea.org/stats/index.asp), subject to https://www.iea.org/t&c/termsandconditions/
Categories, topics:
Energy & Mining, Climate Change, Infrastructure
Last updated:
apr 23, 2017
Indicators value changes by year
At the date of observation
Value
Absolute change
Change from previous value
jan 1, 1972
3.172
+3.172
0.0%
jan 1, 1973
2.742
-0.43
-13.55%
jan 1, 1974
2.466
-0.276
-10.06%
jan 1, 1975
2.244
-0.222
-8.99%
jan 1, 1976
2.004
-0.24
-10.7%
jan 1, 1977
1.92
-0.084
-4.2%
jan 1, 1978
1.847
-0.073
-3.79%
jan 1, 1979
2.188
+0.34
18.42%
jan 1, 1980
2.042
-0.146
-6.66%
jan 1, 1981
2.1
+0.058
2.86%
jan 1, 1982
2.364
+0.264
12.55%
jan 1, 1983
2.378
+0.014
0.59%
jan 1, 1984
2.37
-0.008
-0.35%
jan 1, 1985
2.836
+0.466
19.67%
jan 1, 1986
3.01
+0.174
6.14%
jan 1, 1987
3.453
+0.443
14.7%
jan 1, 1988
3.387
-0.066
-1.91%
jan 1, 1989
3.57
+0.183
5.4%
jan 1, 1990
3.852
+0.282
7.9%
jan 1, 1991
3.815
-0.038
-0.97%
jan 1, 1992
3.734
-0.08
-2.11%
jan 1, 1993
3.452
-0.283
-7.57%
jan 1, 1994
3.599
+0.147
4.26%
jan 1, 1995
4.002
+0.403
11.21%
jan 1, 1996
4.288
+0.286
7.14%
jan 1, 1997
4.604
+0.316
7.38%
jan 1, 1998
4.616
+0.012
0.25%
jan 1, 1999
4.597
-0.019
-0.42%
jan 1, 2000
4.864
+0.267
5.81%
jan 1, 2001
4.44
-0.424
-8.71%
jan 1, 2002
4.535
+0.095
2.14%
jan 1, 2003
4.564
+0.028
0.63%
jan 1, 2004
4.915
+0.351
7.69%
jan 1, 2005
4.405
-0.509
-10.37%
jan 1, 2006
5.033
+0.628
14.26%
jan 1, 2007
5.091
+0.057
1.14%
jan 1, 2008
5.114
+0.023
0.46%
jan 1, 2009
4.299
-0.815
-15.94%
jan 1, 2010
4.813
+0.514
11.96%
jan 1, 2011
5.148
+0.335
6.95%
jan 1, 2012
5.223
+0.076
1.47%
jan 1, 2013
5.723
+0.5
9.57%
jan 1, 2014
6.394
+0.671
11.72%
Ranking of countries by current statistics by years


Comments: