29
/
en
AIzaSyAYiBZKx7MnpbEhh9jyipgxe19OcubqV5w
April 1, 2024
105871
China
CHN
true
2
1
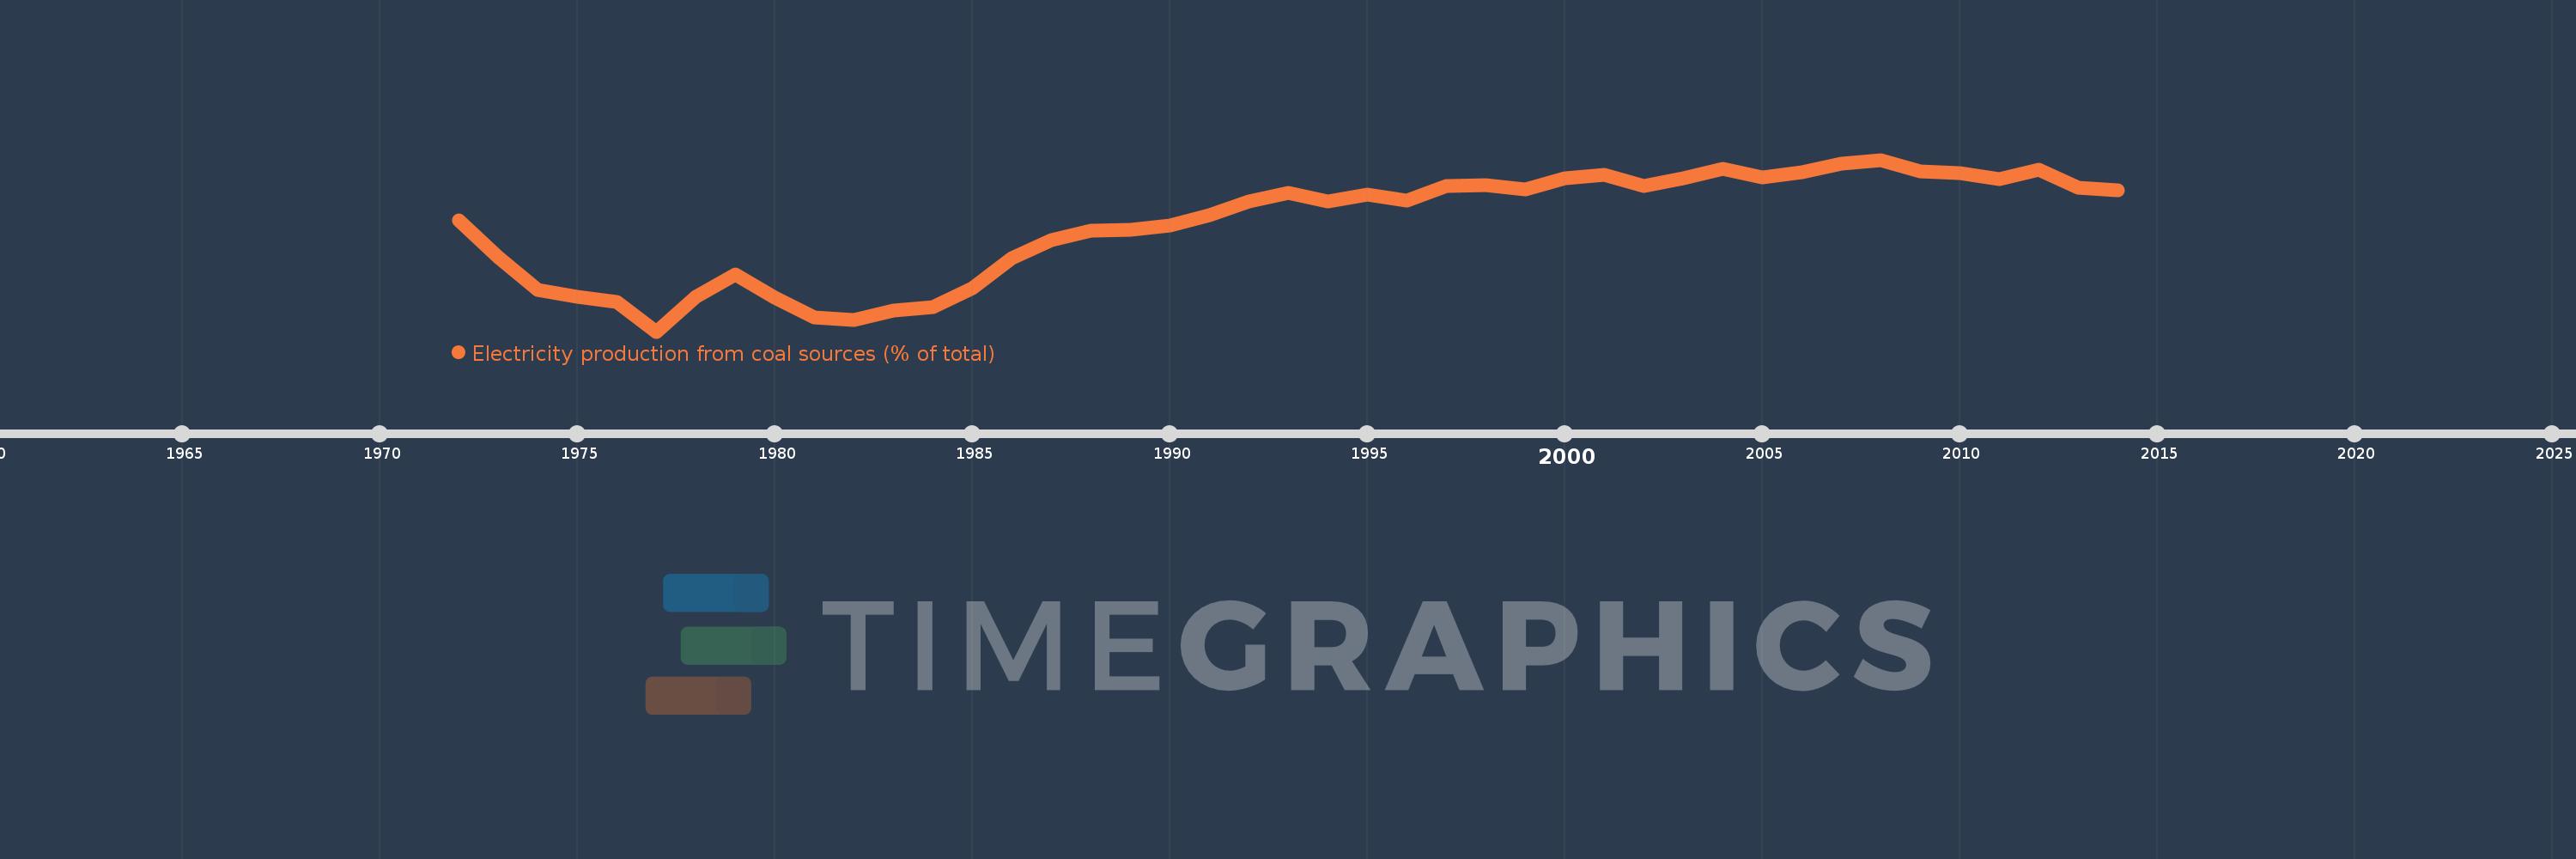
Electricity production from coal sources (% of total)
2014,2013,2012,2011,2010,2009,2008,2007,2006,2005,2004,2003,2002,2001,2000,1999,1998,1997,1996,1995,1994,1993,1992,1991,1990,1989,1988,1987,1986,1985,1984,1983,1982,1981,1980,1979,1978,1977,1976,1975,1974,1973,1972
This statistics in other country:
AlbaniaAlgeriaAngolaArab WorldArgentinaArmeniaAustraliaAustriaAzerbaijanBahrainBangladeshBelarusBelgiumBeninBoliviaBosnia and HerzegovinaBotswanaBrazilBrunei DarussalamBulgariaCambodiaCameroonCanadaCentral Europe and the BalticsChileChinaColombiaCongo, Dem. Rep.Congo, Rep.Costa RicaCote d'IvoireCroatiaCubaCuracaoCyprusCzech RepublicDenmarkDominican RepublicEarly-demographic dividendEast Asia & PacificEast Asia & Pacific (excluding high income)East Asia & Pacific (IDA & IBRD countries)EcuadorEgypt, Arab Rep.El SalvadorEritreaEstoniaEthiopiaEuro areaEurope & Central AsiaEurope & Central Asia (excluding high income)Europe & Central Asia (IDA & IBRD countries)European UnionFinlandFragile and conflict affected situationsFranceGabonGeorgiaGermanyGhanaGibraltarGreeceGuatemalaHaitiHeavily indebted poor countries (HIPC)High incomeHondurasHong Kong SAR, ChinaHungaryIBRD onlyIcelandIDA & IBRD totalIDA blendIDA onlyIDA totalIndiaIndonesiaIran, Islamic Rep.IraqIrelandIsraelItalyJamaicaJapanJordanKazakhstanKenyaKorea, Dem. People’s Rep.Korea, Rep.KosovoKuwaitKyrgyz RepublicLate-demographic dividendLatin America & Caribbean Latin America & Caribbean (excluding high income)Latin America & the Caribbean (IDA & IBRD countries)LatviaLeast developed countries: UN classificationLebanonLibyaLithuaniaLow & middle incomeLower middle incomeLuxembourgMacedonia, FYRMalaysiaMaltaMauritiusMexicoMiddle East & North AfricaMiddle East & North Africa (excluding high income)Middle East & North Africa (IDA & IBRD countries)Middle incomeMoldovaMongoliaMontenegroMoroccoMozambiqueMyanmarNamibiaNepalNetherlandsNew ZealandNicaraguaNigerNigeriaNorth AmericaNorwayOECD membersOmanOther small statesPakistanPanamaParaguayPeruPhilippinesPolandPortugalPost-demographic dividendPre-demographic dividendQatarRomaniaRussian FederationSaudi ArabiaSenegalSerbiaSingaporeSlovak RepublicSloveniaSmall statesSouth AfricaSouth AsiaSouth Asia (IDA & IBRD)South SudanSpainSri LankaSub-Saharan Africa Sub-Saharan Africa (excluding high income)Sub-Saharan Africa (IDA & IBRD countries)SudanSwedenSwitzerlandSyrian Arab RepublicTajikistanTanzaniaThailandTogoTrinidad and TobagoTunisiaTurkeyTurkmenistanUkraineUnited Arab EmiratesUnited KingdomUnited StatesUpper middle incomeUruguayUzbekistanVenezuela, RBVietnamWorldYemen, Rep.ZambiaZimbabwe Timeline:
This timeline shows a graph from 1972 to 2014 of China. No data until 1971. Number of actual observations by date: 43.
Source name:
World Development Indicators
Source organization:
IEA Statistics © OECD/IEA 2014 (http://www.iea.org/stats/index.asp), subject to https://www.iea.org/t&c/termsandconditions/
Categories, topics:
Energy & Mining, Climate Change, Infrastructure
Last updated:
apr 23, 2017
Indicators value changes by year
Minimum:
50.572
jan 1, 1977
At the date of observation
Value
Absolute change
Change from previous value
jan 1, 1972
70.122
+70.122
0.0%
jan 1, 1973
63.618
-6.503
-9.27%
jan 1, 1974
57.925
-5.694
-8.95%
jan 1, 1975
56.781
-1.144
-1.97%
jan 1, 1976
55.812
-0.968
-1.71%
jan 1, 1977
50.572
-5.241
-9.39%
jan 1, 1978
56.643
+6.071
12.01%
jan 1, 1979
60.578
+3.935
6.95%
jan 1, 1980
56.514
-4.064
-6.71%
jan 1, 1981
53.035
-3.479
-6.16%
jan 1, 1982
52.669
-0.366
-0.69%
jan 1, 1983
54.326
+1.657
3.15%
jan 1, 1984
54.851
+0.525
0.97%
jan 1, 1985
58.285
+3.435
6.26%
jan 1, 1986
63.471
+5.186
8.9%
jan 1, 1987
66.657
+3.186
5.02%
jan 1, 1988
68.354
+1.697
2.55%
jan 1, 1989
68.541
+0.187
0.27%
jan 1, 1990
69.272
+0.732
1.07%
jan 1, 1991
71.04
+1.768
2.55%
jan 1, 1992
73.509
+2.468
3.47%
jan 1, 1993
75.033
+1.524
2.07%
jan 1, 1994
73.505
-1.528
-2.04%
jan 1, 1995
74.79
+1.286
1.75%
jan 1, 1996
73.75
-1.041
-1.39%
jan 1, 1997
76.198
+2.449
3.32%
jan 1, 1998
76.361
+0.163
0.21%
jan 1, 1999
75.638
-0.724
-0.95%
jan 1, 2000
77.672
+2.035
2.69%
jan 1, 2001
78.225
+0.552
0.71%
jan 1, 2002
76.265
-1.959
-2.5%
jan 1, 2003
77.556
+1.291
1.69%
jan 1, 2004
79.359
+1.803
2.32%
jan 1, 2005
77.802
-1.557
-1.96%
jan 1, 2006
78.732
+0.93
1.2%
jan 1, 2007
80.167
+1.435
1.82%
jan 1, 2008
80.88
+0.713
0.89%
jan 1, 2009
78.799
-2.081
-2.57%
jan 1, 2010
78.588
-0.21
-0.27%
jan 1, 2011
77.441
-1.148
-1.46%
jan 1, 2012
79.138
+1.697
2.19%
jan 1, 2013
75.932
-3.205
-4.05%
jan 1, 2014
75.44
-0.492
-0.65%
Ranking of countries by current statistics by years


Comments: