29
/
en
AIzaSyAYiBZKx7MnpbEhh9jyipgxe19OcubqV5w
April 1, 2024
262117
Thailand
THA
true
2
1
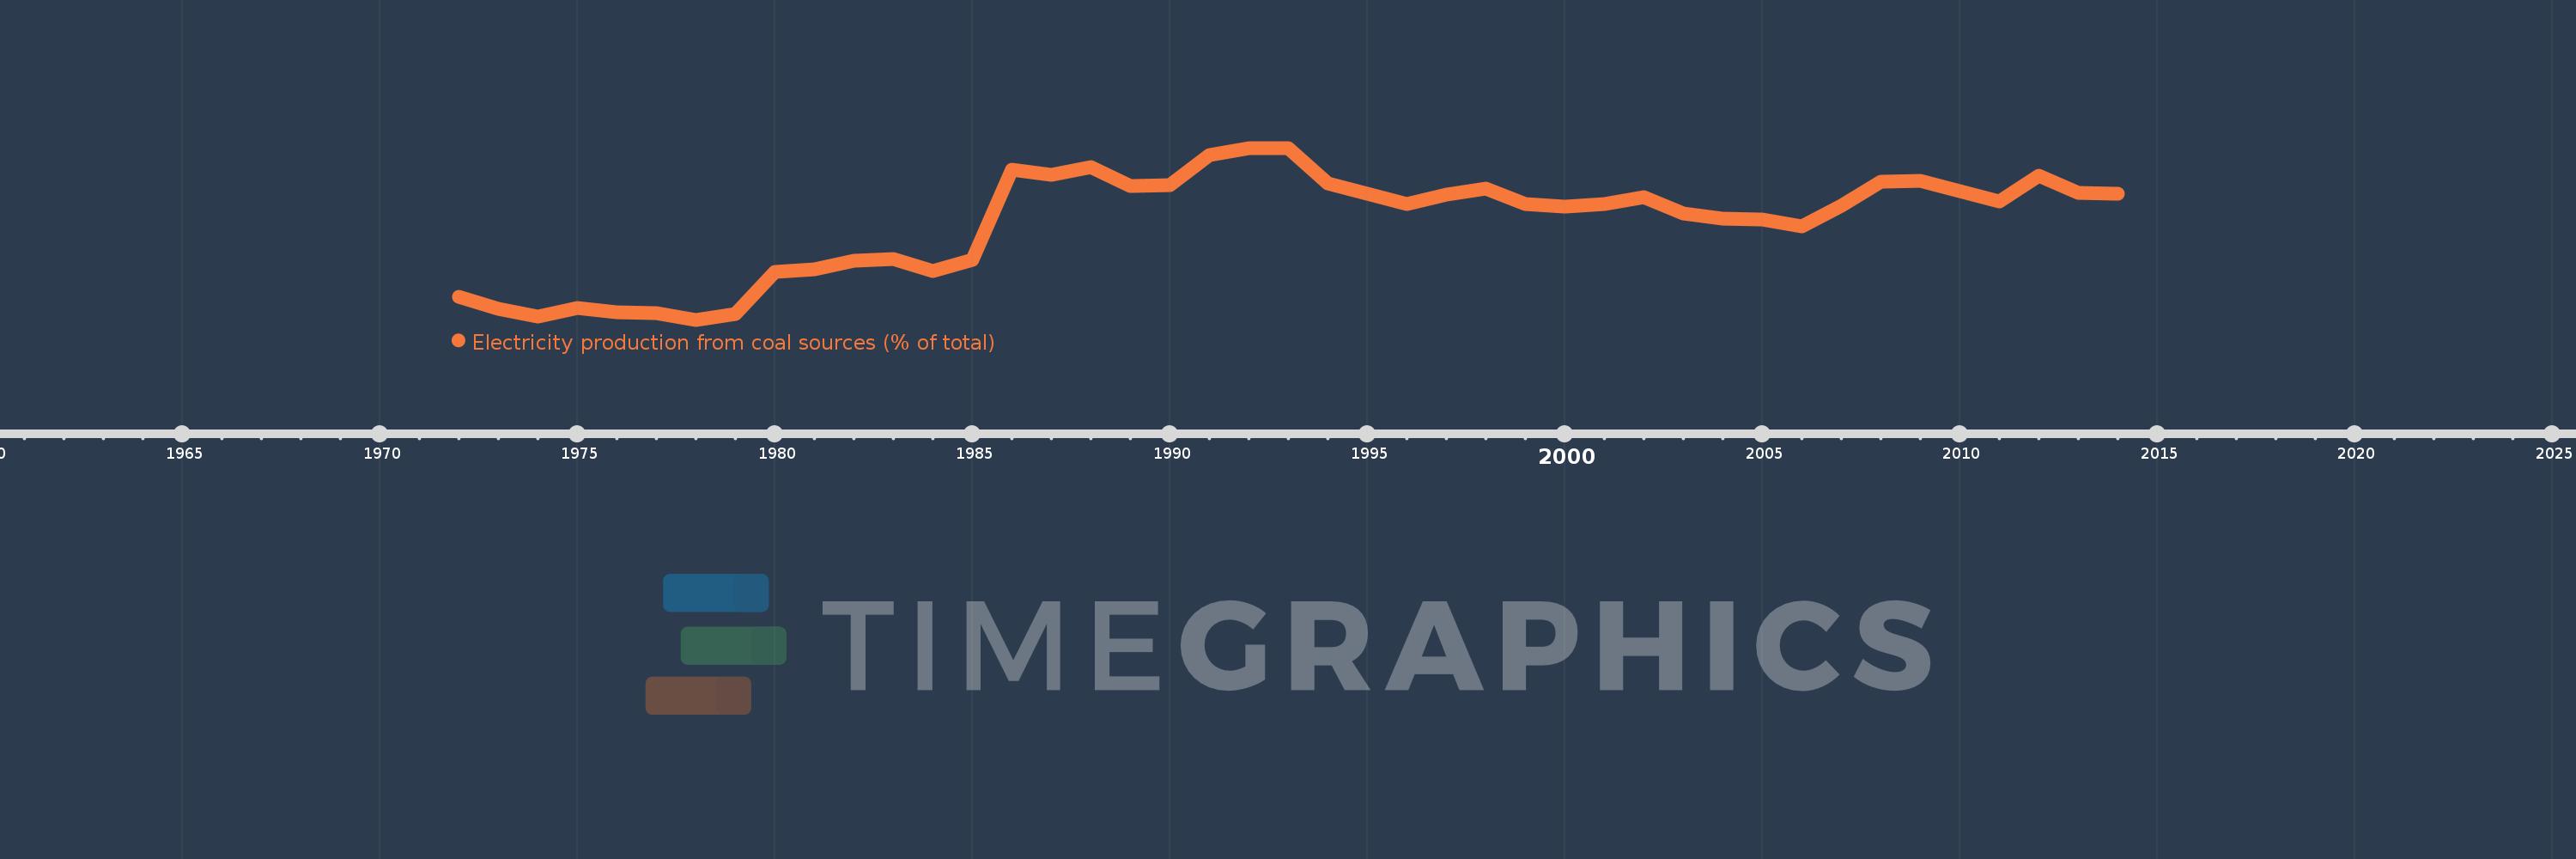
Electricity production from coal sources (% of total)
2014,2013,2012,2011,2010,2009,2008,2007,2006,2005,2004,2003,2002,2001,2000,1999,1998,1997,1996,1995,1994,1993,1992,1991,1990,1989,1988,1987,1986,1985,1984,1983,1982,1981,1980,1979,1978,1977,1976,1975,1974,1973,1972
This statistics in other country:
AlbaniaAlgeriaAngolaArab WorldArgentinaArmeniaAustraliaAustriaAzerbaijanBahrainBangladeshBelarusBelgiumBeninBoliviaBosnia and HerzegovinaBotswanaBrazilBrunei DarussalamBulgariaCambodiaCameroonCanadaCentral Europe and the BalticsChileChinaColombiaCongo, Dem. Rep.Congo, Rep.Costa RicaCote d'IvoireCroatiaCubaCuracaoCyprusCzech RepublicDenmarkDominican RepublicEarly-demographic dividendEast Asia & PacificEast Asia & Pacific (excluding high income)East Asia & Pacific (IDA & IBRD countries)EcuadorEgypt, Arab Rep.El SalvadorEritreaEstoniaEthiopiaEuro areaEurope & Central AsiaEurope & Central Asia (excluding high income)Europe & Central Asia (IDA & IBRD countries)European UnionFinlandFragile and conflict affected situationsFranceGabonGeorgiaGermanyGhanaGibraltarGreeceGuatemalaHaitiHeavily indebted poor countries (HIPC)High incomeHondurasHong Kong SAR, ChinaHungaryIBRD onlyIcelandIDA & IBRD totalIDA blendIDA onlyIDA totalIndiaIndonesiaIran, Islamic Rep.IraqIrelandIsraelItalyJamaicaJapanJordanKazakhstanKenyaKorea, Dem. People’s Rep.Korea, Rep.KosovoKuwaitKyrgyz RepublicLate-demographic dividendLatin America & Caribbean Latin America & Caribbean (excluding high income)Latin America & the Caribbean (IDA & IBRD countries)LatviaLeast developed countries: UN classificationLebanonLibyaLithuaniaLow & middle incomeLower middle incomeLuxembourgMacedonia, FYRMalaysiaMaltaMauritiusMexicoMiddle East & North AfricaMiddle East & North Africa (excluding high income)Middle East & North Africa (IDA & IBRD countries)Middle incomeMoldovaMongoliaMontenegroMoroccoMozambiqueMyanmarNamibiaNepalNetherlandsNew ZealandNicaraguaNigerNigeriaNorth AmericaNorwayOECD membersOmanOther small statesPakistanPanamaParaguayPeruPhilippinesPolandPortugalPost-demographic dividendPre-demographic dividendQatarRomaniaRussian FederationSaudi ArabiaSenegalSerbiaSingaporeSlovak RepublicSloveniaSmall statesSouth AfricaSouth AsiaSouth Asia (IDA & IBRD)South SudanSpainSri LankaSub-Saharan Africa Sub-Saharan Africa (excluding high income)Sub-Saharan Africa (IDA & IBRD countries)SudanSwedenSwitzerlandSyrian Arab RepublicTajikistanTanzaniaThailandTogoTrinidad and TobagoTunisiaTurkeyTurkmenistanUkraineUnited Arab EmiratesUnited KingdomUnited StatesUpper middle incomeUruguayUzbekistanVenezuela, RBVietnamWorldYemen, Rep.ZambiaZimbabwe Timeline:
This timeline shows a graph from 1972 to 2014 of Thailand. No data until 1971. Number of actual observations by date: 43.
Source name:
World Development Indicators
Source organization:
IEA Statistics © OECD/IEA 2014 (http://www.iea.org/stats/index.asp), subject to https://www.iea.org/t&c/termsandconditions/
Categories, topics:
Energy & Mining, Climate Change, Infrastructure
Last updated:
apr 23, 2017
Indicators value changes by year
Maximum:
25.978
jan 1, 1992
At the date of observation
Value
Absolute change
Change from previous value
jan 1, 1972
6.099
+6.099
0.0%
jan 1, 1973
4.485
-1.613
-26.45%
jan 1, 1974
3.5
-0.985
-21.96%
jan 1, 1975
4.665
+1.165
33.29%
jan 1, 1976
4.052
-0.613
-13.14%
jan 1, 1977
3.939
-0.114
-2.8%
jan 1, 1978
3.087
-0.851
-21.61%
jan 1, 1979
3.87
+0.782
25.34%
jan 1, 1980
9.47
+5.6
144.72%
jan 1, 1981
9.774
+0.304
3.21%
jan 1, 1982
10.899
+1.125
11.51%
jan 1, 1983
11.136
+0.237
2.18%
jan 1, 1984
9.567
-1.568
-14.09%
jan 1, 1985
11.021
+1.453
15.19%
jan 1, 1986
23.026
+12.005
108.93%
jan 1, 1987
22.434
-0.592
-2.57%
jan 1, 1988
23.377
+0.943
4.2%
jan 1, 1989
20.946
-2.431
-10.4%
jan 1, 1990
21.063
+0.117
0.56%
jan 1, 1991
25.02
+3.957
18.79%
jan 1, 1992
25.978
+0.958
3.83%
jan 1, 1993
25.947
-0.031
-0.12%
jan 1, 1994
21.297
-4.649
-17.92%
jan 1, 1995
19.853
-1.444
-6.78%
jan 1, 1996
18.456
-1.397
-7.04%
jan 1, 1997
19.71
+1.254
6.8%
jan 1, 1998
20.544
+0.833
4.23%
jan 1, 1999
18.483
-2.061
-10.03%
jan 1, 2000
18.197
-0.286
-1.55%
jan 1, 2001
18.518
+0.321
1.77%
jan 1, 2002
19.399
+0.881
4.76%
jan 1, 2003
17.28
-2.119
-10.92%
jan 1, 2004
16.557
-0.722
-4.18%
jan 1, 2005
16.389
-0.168
-1.02%
jan 1, 2006
15.524
-0.865
-5.28%
jan 1, 2007
18.242
+2.718
17.51%
jan 1, 2008
21.459
+3.218
17.64%
jan 1, 2009
21.551
+0.092
0.43%
jan 1, 2010
20.239
-1.312
-6.09%
jan 1, 2011
18.836
-1.404
-6.94%
jan 1, 2012
22.315
+3.479
18.47%
jan 1, 2013
19.996
-2.319
-10.39%
jan 1, 2014
19.865
-0.131
-0.66%
Ranking of countries by current statistics by years


Comments: