29
/
en
AIzaSyAYiBZKx7MnpbEhh9jyipgxe19OcubqV5w
April 1, 2024
27200
East Asia & Pacific
EAS
false
2
1
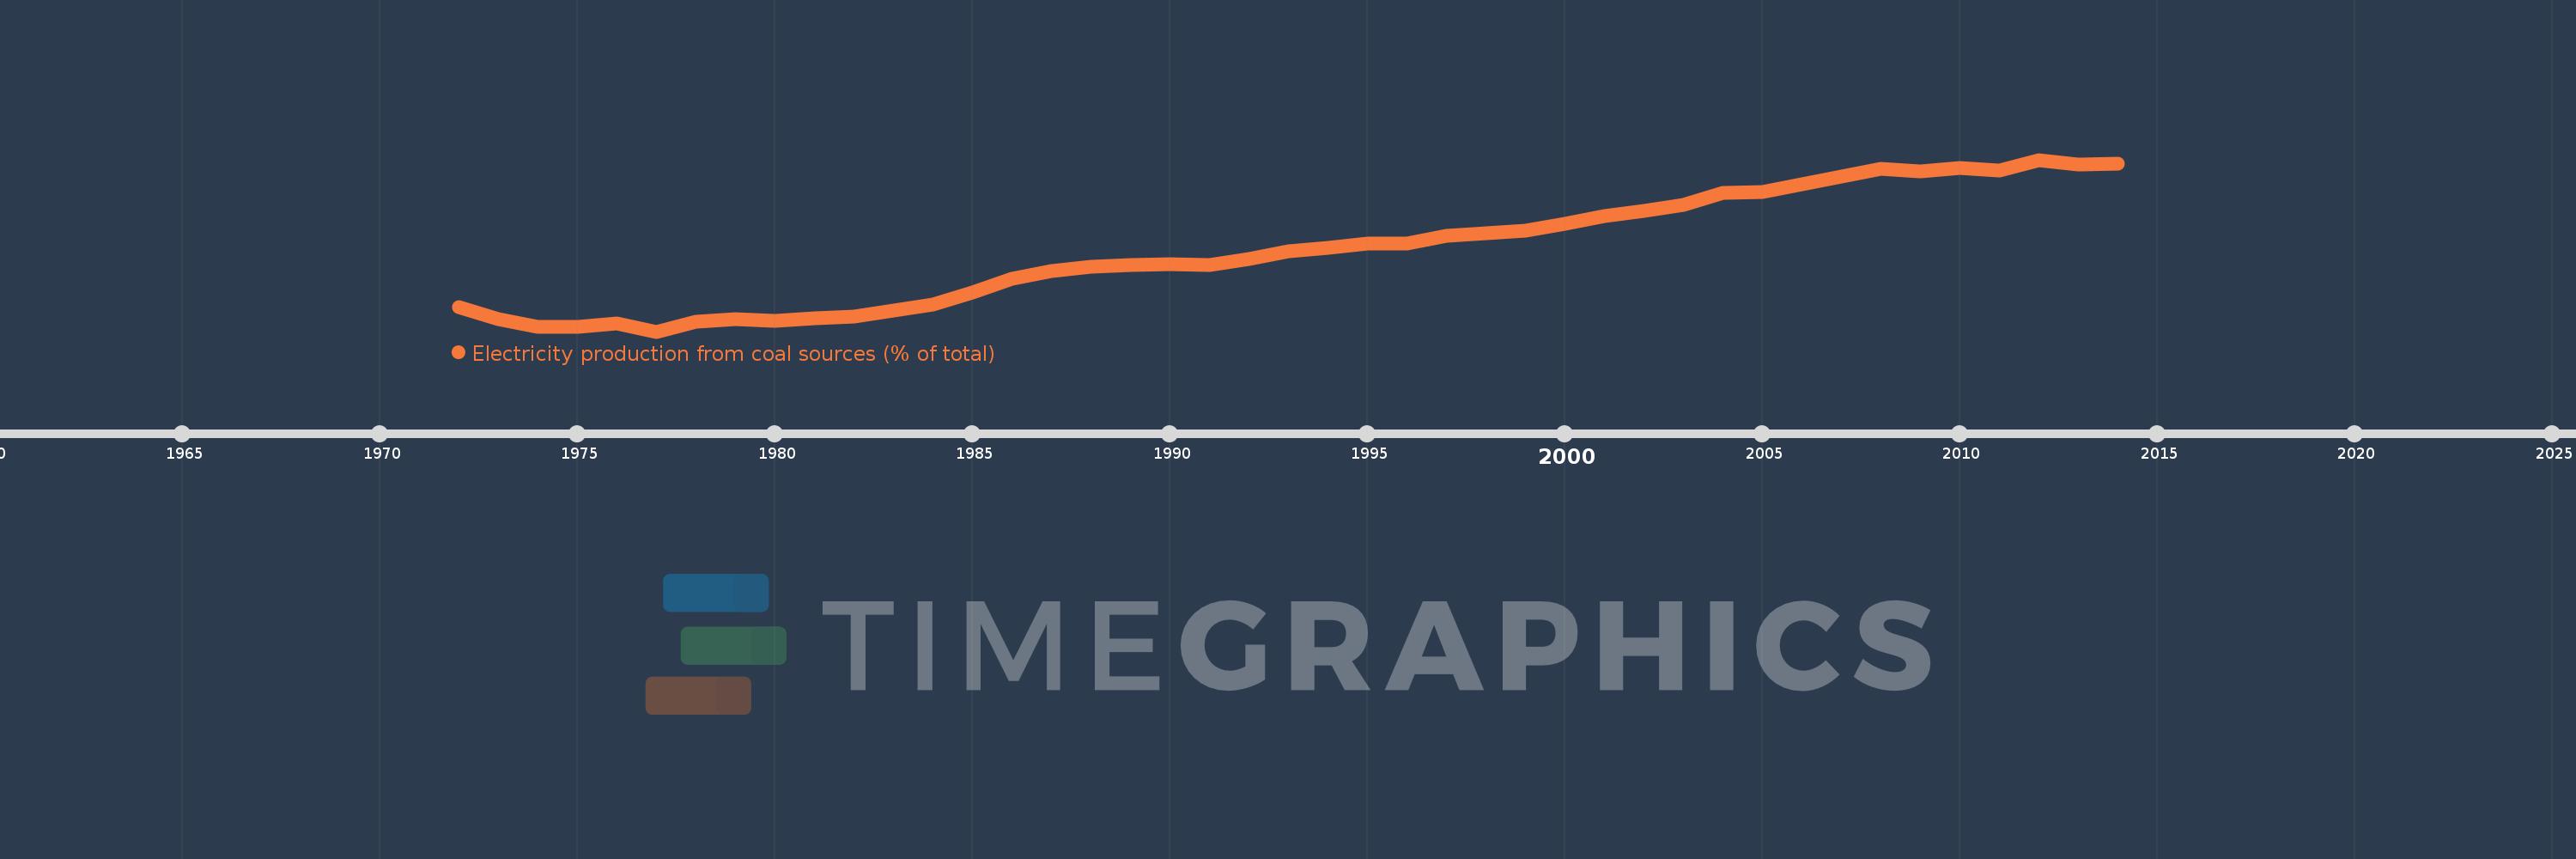
Electricity production from coal sources (% of total)
2014,2013,2012,2011,2010,2009,2008,2007,2006,2005,2004,2003,2002,2001,2000,1999,1998,1997,1996,1995,1994,1993,1992,1991,1990,1989,1988,1987,1986,1985,1984,1983,1982,1981,1980,1979,1978,1977,1976,1975,1974,1973,1972
This statistics in other country:
AlbaniaAlgeriaAngolaArab WorldArgentinaArmeniaAustraliaAustriaAzerbaijanBahrainBangladeshBelarusBelgiumBeninBoliviaBosnia and HerzegovinaBotswanaBrazilBrunei DarussalamBulgariaCambodiaCameroonCanadaCentral Europe and the BalticsChileChinaColombiaCongo, Dem. Rep.Congo, Rep.Costa RicaCote d'IvoireCroatiaCubaCuracaoCyprusCzech RepublicDenmarkDominican RepublicEarly-demographic dividendEast Asia & PacificEast Asia & Pacific (excluding high income)East Asia & Pacific (IDA & IBRD countries)EcuadorEgypt, Arab Rep.El SalvadorEritreaEstoniaEthiopiaEuro areaEurope & Central AsiaEurope & Central Asia (excluding high income)Europe & Central Asia (IDA & IBRD countries)European UnionFinlandFragile and conflict affected situationsFranceGabonGeorgiaGermanyGhanaGibraltarGreeceGuatemalaHaitiHeavily indebted poor countries (HIPC)High incomeHondurasHong Kong SAR, ChinaHungaryIBRD onlyIcelandIDA & IBRD totalIDA blendIDA onlyIDA totalIndiaIndonesiaIran, Islamic Rep.IraqIrelandIsraelItalyJamaicaJapanJordanKazakhstanKenyaKorea, Dem. People’s Rep.Korea, Rep.KosovoKuwaitKyrgyz RepublicLate-demographic dividendLatin America & Caribbean Latin America & Caribbean (excluding high income)Latin America & the Caribbean (IDA & IBRD countries)LatviaLeast developed countries: UN classificationLebanonLibyaLithuaniaLow & middle incomeLower middle incomeLuxembourgMacedonia, FYRMalaysiaMaltaMauritiusMexicoMiddle East & North AfricaMiddle East & North Africa (excluding high income)Middle East & North Africa (IDA & IBRD countries)Middle incomeMoldovaMongoliaMontenegroMoroccoMozambiqueMyanmarNamibiaNepalNetherlandsNew ZealandNicaraguaNigerNigeriaNorth AmericaNorwayOECD membersOmanOther small statesPakistanPanamaParaguayPeruPhilippinesPolandPortugalPost-demographic dividendPre-demographic dividendQatarRomaniaRussian FederationSaudi ArabiaSenegalSerbiaSingaporeSlovak RepublicSloveniaSmall statesSouth AfricaSouth AsiaSouth Asia (IDA & IBRD)South SudanSpainSri LankaSub-Saharan Africa Sub-Saharan Africa (excluding high income)Sub-Saharan Africa (IDA & IBRD countries)SudanSwedenSwitzerlandSyrian Arab RepublicTajikistanTanzaniaThailandTogoTrinidad and TobagoTunisiaTurkeyTurkmenistanUkraineUnited Arab EmiratesUnited KingdomUnited StatesUpper middle incomeUruguayUzbekistanVenezuela, RBVietnamWorldYemen, Rep.ZambiaZimbabwe Timeline:
This timeline shows a graph from 1972 to 2014 of East Asia & Pacific. No data until 1971. Number of actual observations by date: 43.
Source name:
World Development Indicators
Source organization:
IEA Statistics © OECD/IEA 2014 (http://www.iea.org/stats/index.asp), subject to https://www.iea.org/t&c/termsandconditions/
Categories, topics:
Energy & Mining, Climate Change, Infrastructure
Last updated:
apr 23, 2017
Indicators value changes by year
Maximum:
62.871
jan 1, 2012
At the date of observation
Value
Absolute change
Change from previous value
jan 1, 1972
28.689
+28.689
0.0%
jan 1, 1973
25.868
-2.821
-9.83%
jan 1, 1974
24.026
-1.841
-7.12%
jan 1, 1975
24.012
-0.014
-0.06%
jan 1, 1976
24.782
+0.77
3.21%
jan 1, 1977
22.92
-1.862
-7.51%
jan 1, 1978
25.133
+2.213
9.66%
jan 1, 1979
25.831
+0.697
2.78%
jan 1, 1980
25.367
-0.463
-1.79%
jan 1, 1981
26.072
+0.705
2.78%
jan 1, 1982
26.502
+0.43
1.65%
jan 1, 1983
27.821
+1.319
4.98%
jan 1, 1984
29.175
+1.354
4.87%
jan 1, 1985
31.998
+2.823
9.68%
jan 1, 1986
35.267
+3.268
10.21%
jan 1, 1987
37.039
+1.773
5.03%
jan 1, 1988
38.061
+1.021
2.76%
jan 1, 1989
38.324
+0.263
0.69%
jan 1, 1990
38.51
+0.187
0.49%
jan 1, 1991
38.454
-0.057
-0.15%
jan 1, 1992
39.817
+1.363
3.54%
jan 1, 1993
41.674
+1.857
4.66%
jan 1, 1994
42.454
+0.78
1.87%
jan 1, 1995
43.308
+0.854
2.01%
jan 1, 1996
43.474
+0.166
0.38%
jan 1, 1997
45.127
+1.652
3.8%
jan 1, 1998
45.78
+0.654
1.45%
jan 1, 1999
46.353
+0.572
1.25%
jan 1, 2000
47.963
+1.611
3.48%
jan 1, 2001
49.818
+1.854
3.87%
jan 1, 2002
50.966
+1.148
2.31%
jan 1, 2003
52.38
+1.414
2.78%
jan 1, 2004
55.144
+2.763
5.28%
jan 1, 2005
55.394
+0.25
0.45%
jan 1, 2006
57.099
+1.705
3.08%
jan 1, 2007
58.97
+1.871
3.28%
jan 1, 2008
60.714
+1.743
2.96%
jan 1, 2009
60.193
-0.52
-0.86%
jan 1, 2010
60.993
+0.8
1.33%
jan 1, 2011
60.417
-0.576
-0.94%
jan 1, 2012
62.871
+2.454
4.06%
jan 1, 2013
61.826
-1.045
-1.66%
jan 1, 2014
62.064
+0.238
0.38%
Ranking of countries by current statistics by years


Comments: