29
/
en
AIzaSyAYiBZKx7MnpbEhh9jyipgxe19OcubqV5w
April 1, 2024
195425
Mexico
MEX
true
2
1
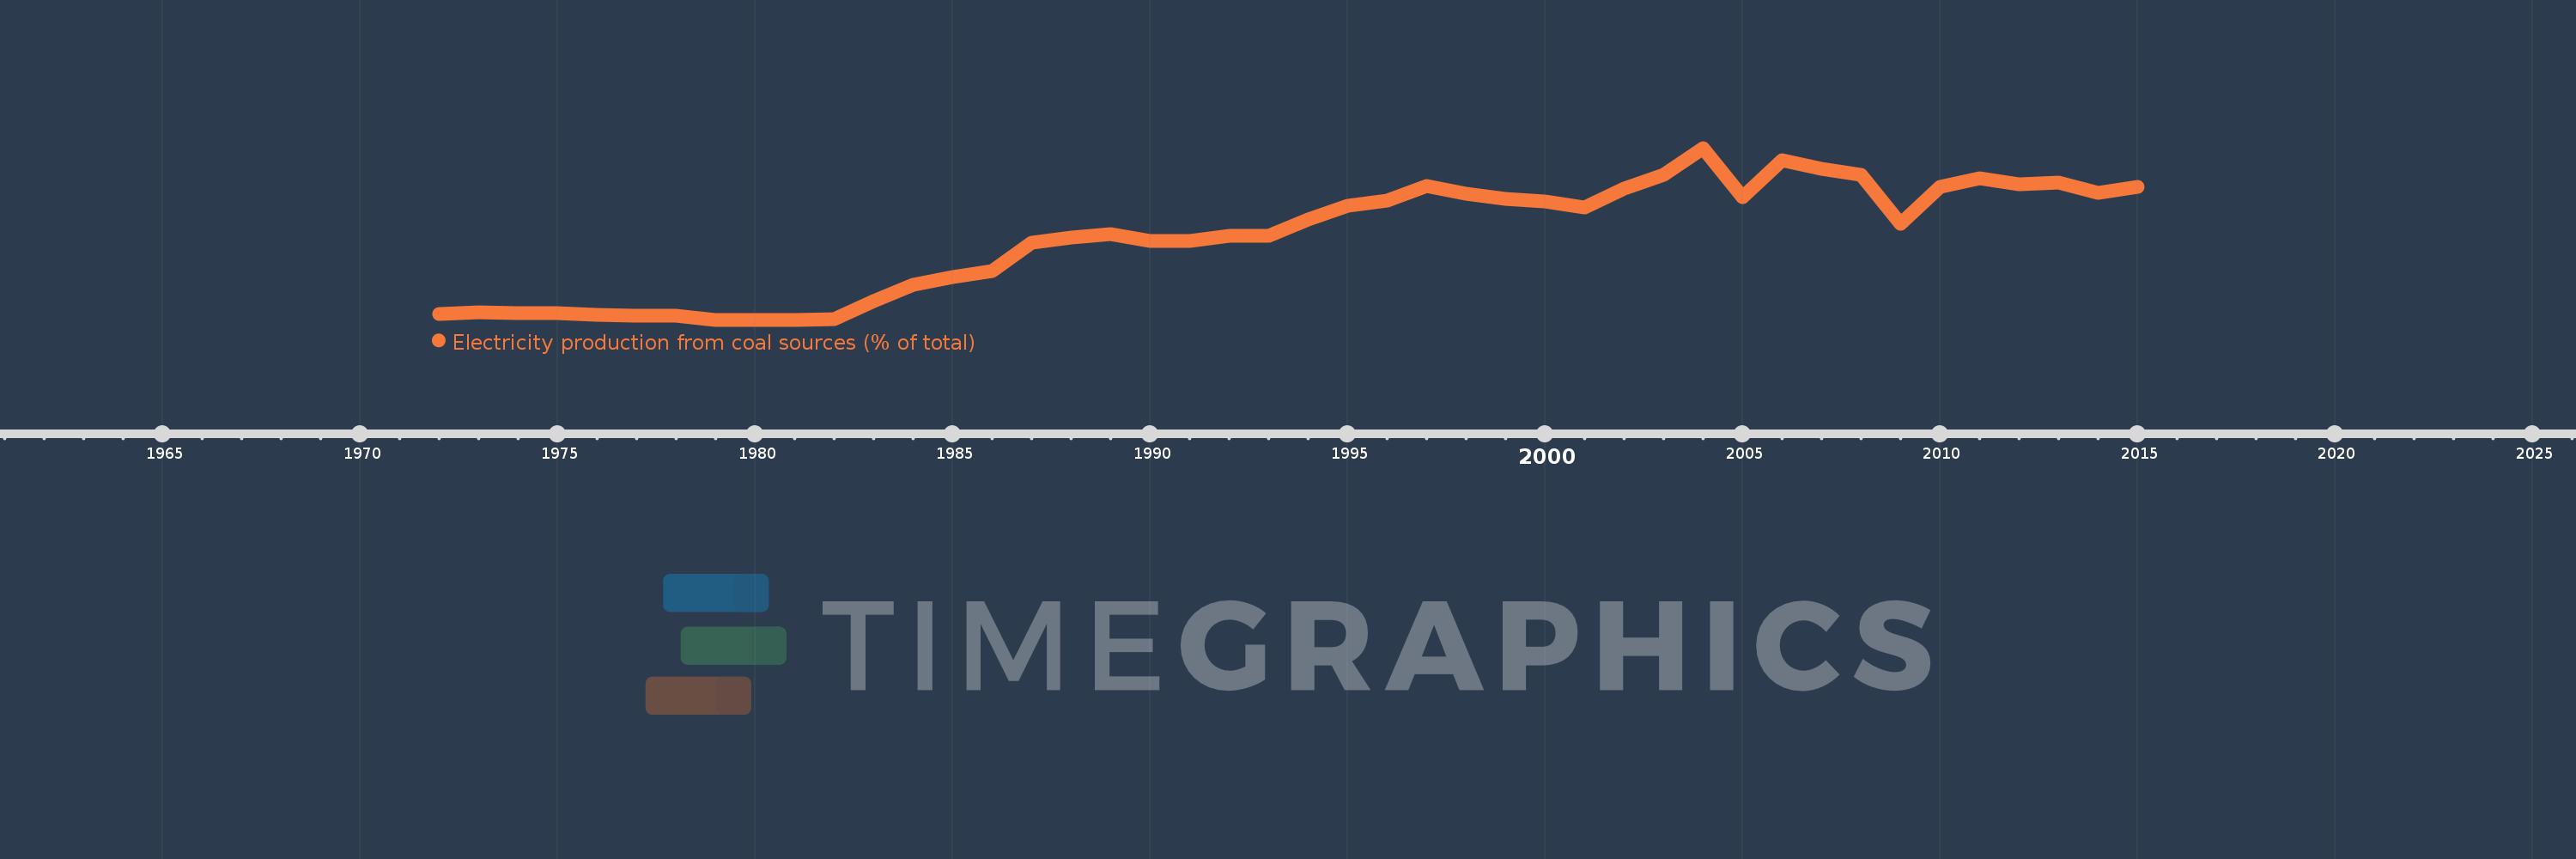
Electricity production from coal sources (% of total)
2015,2014,2013,2012,2011,2010,2009,2008,2007,2006,2005,2004,2003,2002,2001,2000,1999,1998,1997,1996,1995,1994,1993,1992,1991,1990,1989,1988,1987,1986,1985,1984,1983,1982,1981,1980,1979,1978,1977,1976,1975,1974,1973,1972
This statistics in other country:
AlbaniaAlgeriaAngolaArab WorldArgentinaArmeniaAustraliaAustriaAzerbaijanBahrainBangladeshBelarusBelgiumBeninBoliviaBosnia and HerzegovinaBotswanaBrazilBrunei DarussalamBulgariaCambodiaCameroonCanadaCentral Europe and the BalticsChileChinaColombiaCongo, Dem. Rep.Congo, Rep.Costa RicaCote d'IvoireCroatiaCubaCuracaoCyprusCzech RepublicDenmarkDominican RepublicEarly-demographic dividendEast Asia & PacificEast Asia & Pacific (excluding high income)East Asia & Pacific (IDA & IBRD countries)EcuadorEgypt, Arab Rep.El SalvadorEritreaEstoniaEthiopiaEuro areaEurope & Central AsiaEurope & Central Asia (excluding high income)Europe & Central Asia (IDA & IBRD countries)European UnionFinlandFragile and conflict affected situationsFranceGabonGeorgiaGermanyGhanaGibraltarGreeceGuatemalaHaitiHeavily indebted poor countries (HIPC)High incomeHondurasHong Kong SAR, ChinaHungaryIBRD onlyIcelandIDA & IBRD totalIDA blendIDA onlyIDA totalIndiaIndonesiaIran, Islamic Rep.IraqIrelandIsraelItalyJamaicaJapanJordanKazakhstanKenyaKorea, Dem. People’s Rep.Korea, Rep.KosovoKuwaitKyrgyz RepublicLate-demographic dividendLatin America & Caribbean Latin America & Caribbean (excluding high income)Latin America & the Caribbean (IDA & IBRD countries)LatviaLeast developed countries: UN classificationLebanonLibyaLithuaniaLow & middle incomeLower middle incomeLuxembourgMacedonia, FYRMalaysiaMaltaMauritiusMexicoMiddle East & North AfricaMiddle East & North Africa (excluding high income)Middle East & North Africa (IDA & IBRD countries)Middle incomeMoldovaMongoliaMontenegroMoroccoMozambiqueMyanmarNamibiaNepalNetherlandsNew ZealandNicaraguaNigerNigeriaNorth AmericaNorwayOECD membersOmanOther small statesPakistanPanamaParaguayPeruPhilippinesPolandPortugalPost-demographic dividendPre-demographic dividendQatarRomaniaRussian FederationSaudi ArabiaSenegalSerbiaSingaporeSlovak RepublicSloveniaSmall statesSouth AfricaSouth AsiaSouth Asia (IDA & IBRD)South SudanSpainSri LankaSub-Saharan Africa Sub-Saharan Africa (excluding high income)Sub-Saharan Africa (IDA & IBRD countries)SudanSwedenSwitzerlandSyrian Arab RepublicTajikistanTanzaniaThailandTogoTrinidad and TobagoTunisiaTurkeyTurkmenistanUkraineUnited Arab EmiratesUnited KingdomUnited StatesUpper middle incomeUruguayUzbekistanVenezuela, RBVietnamWorldYemen, Rep.ZambiaZimbabwe Timeline:
This timeline shows a graph from 1972 to 2015 of Mexico. No data until 1971. Number of actual observations by date: 44.
Source name:
World Development Indicators
Source organization:
IEA Statistics © OECD/IEA 2014 (http://www.iea.org/stats/index.asp), subject to https://www.iea.org/t&c/termsandconditions/
Categories, topics:
Energy & Mining, Climate Change, Infrastructure
Last updated:
apr 23, 2017
Indicators value changes by year
Maximum:
14.606
jan 1, 2004
At the date of observation
Value
Absolute change
Change from previous value
jan 1, 1972
0.515
+0.515
0.0%
jan 1, 1973
0.649
+0.134
25.9%
jan 1, 1974
0.558
-0.091
-14.03%
jan 1, 1975
0.544
-0.014
-2.48%
jan 1, 1976
0.444
-0.1
-18.41%
jan 1, 1977
0.379
-0.065
-14.68%
jan 1, 1978
0.362
-0.017
-4.51%
jan 1, 1979
0.0
-0.362
-100.0%
jan 1, 1982
0.045
+0.045
%
jan 1, 1983
1.597
+1.551
3.44K%
jan 1, 1984
2.961
+1.364
85.43%
jan 1, 1985
3.603
+0.642
21.7%
jan 1, 1986
4.142
+0.54
14.97%
jan 1, 1987
6.524
+2.382
57.49%
jan 1, 1988
7.009
+0.485
7.43%
jan 1, 1989
7.314
+0.305
4.35%
jan 1, 1990
6.703
-0.611
-8.35%
jan 1, 1991
6.711
+0.008
0.12%
jan 1, 1992
7.166
+0.455
6.77%
jan 1, 1993
7.164
-0.001
-0.02%
jan 1, 1994
8.492
+1.328
18.54%
jan 1, 1995
9.678
+1.185
13.96%
jan 1, 1996
10.136
+0.458
4.74%
jan 1, 1997
11.393
+1.256
12.4%
jan 1, 1998
10.707
-0.686
-6.02%
jan 1, 1999
10.287
-0.42
-3.92%
jan 1, 2000
10.06
-0.227
-2.2%
jan 1, 2001
9.517
-0.543
-5.4%
jan 1, 2002
11.153
+1.635
17.18%
jan 1, 2003
12.297
+1.144
10.26%
jan 1, 2004
14.606
+2.31
18.78%
jan 1, 2005
10.402
-4.204
-28.78%
jan 1, 2006
13.557
+3.155
30.33%
jan 1, 2007
12.797
-0.76
-5.6%
jan 1, 2008
12.354
-0.444
-3.47%
jan 1, 2009
8.191
-4.163
-33.7%
jan 1, 2010
11.32
+3.129
38.2%
jan 1, 2011
12.034
+0.714
6.31%
jan 1, 2012
11.537
-0.497
-4.13%
jan 1, 2013
11.677
+0.14
1.21%
jan 1, 2014
10.759
-0.918
-7.87%
jan 1, 2015
11.278
+0.519
4.82%
Ranking of countries by current statistics by years


Comments: