29
/
en
AIzaSyAYiBZKx7MnpbEhh9jyipgxe19OcubqV5w
April 1, 2024
117786
Czech Republic
CZE
true
2
1
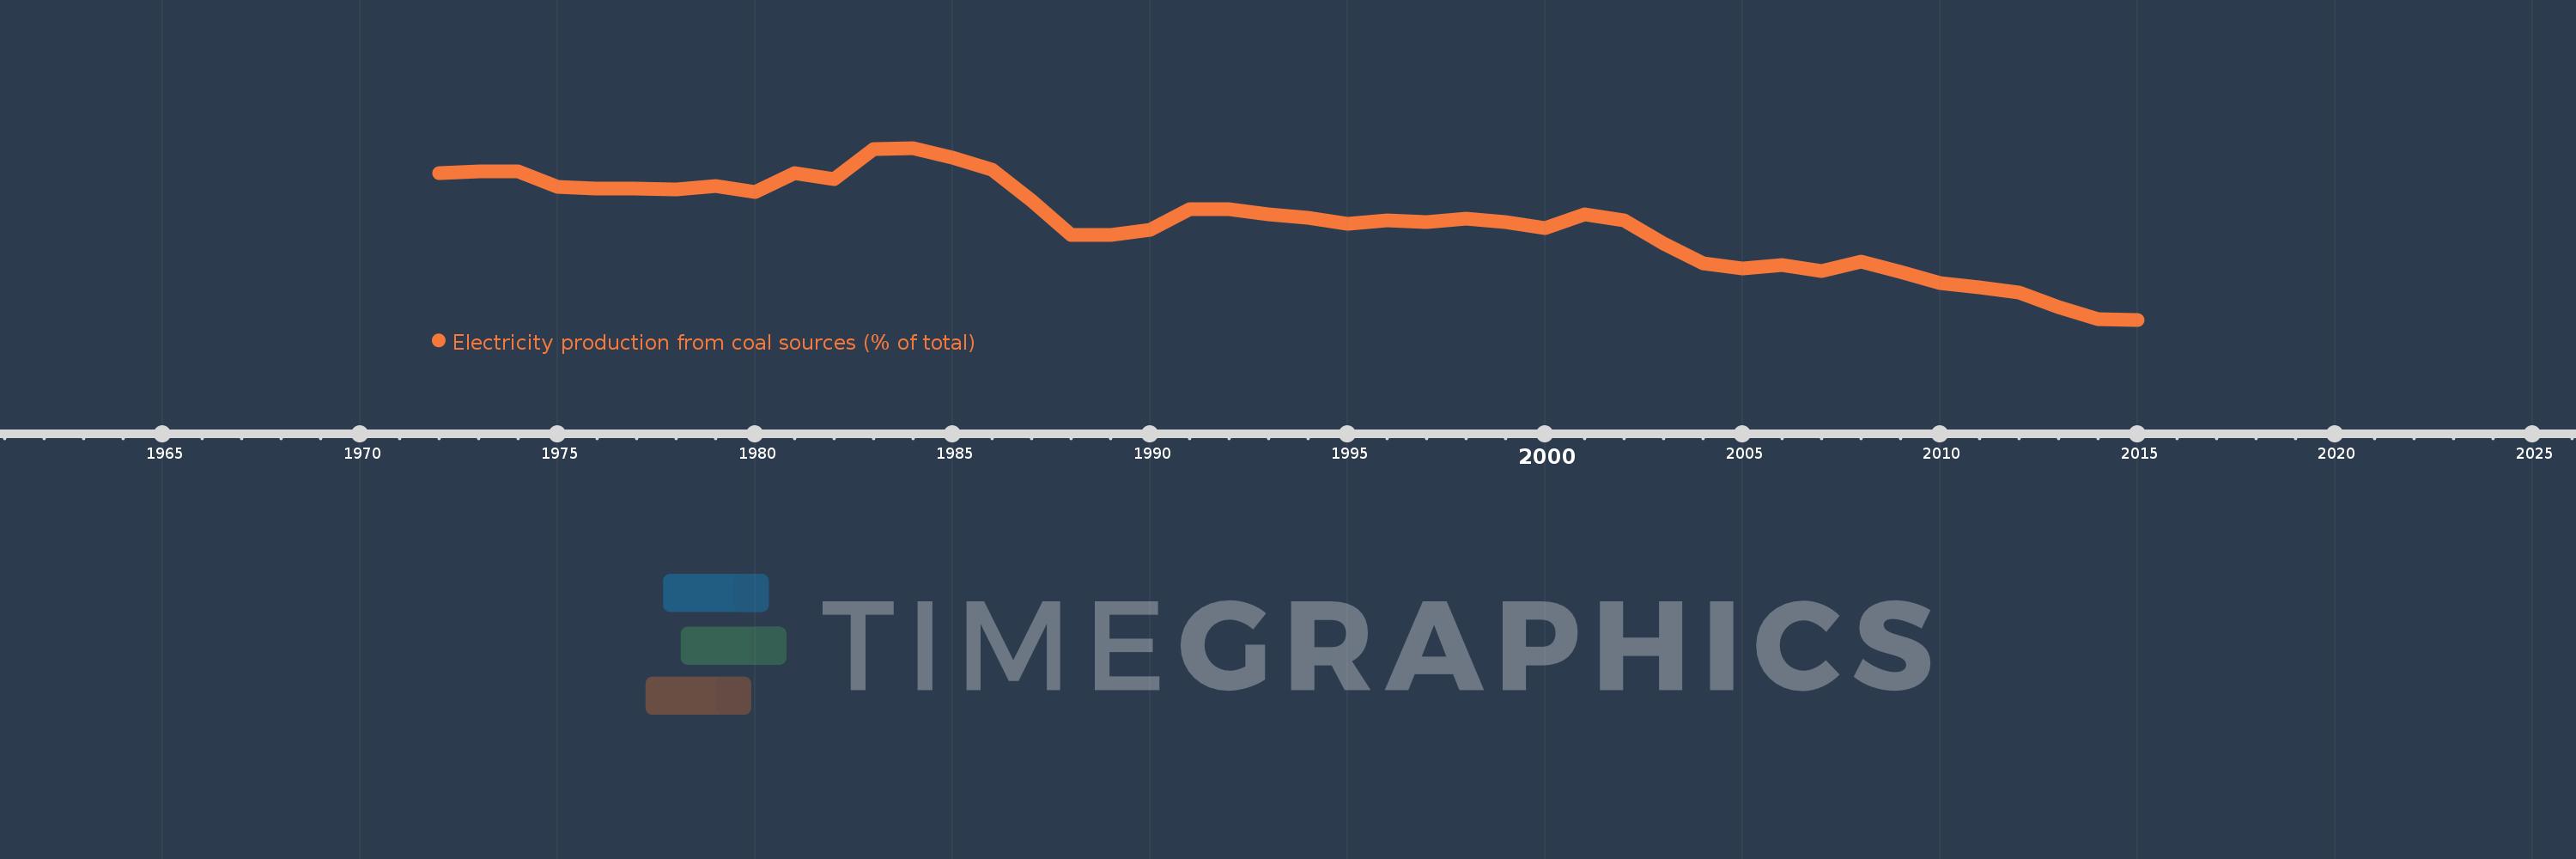
Electricity production from coal sources (% of total)
2015,2014,2013,2012,2011,2010,2009,2008,2007,2006,2005,2004,2003,2002,2001,2000,1999,1998,1997,1996,1995,1994,1993,1992,1991,1990,1989,1988,1987,1986,1985,1984,1983,1982,1981,1980,1979,1978,1977,1976,1975,1974,1973,1972
This statistics in other country:
AlbaniaAlgeriaAngolaArab WorldArgentinaArmeniaAustraliaAustriaAzerbaijanBahrainBangladeshBelarusBelgiumBeninBoliviaBosnia and HerzegovinaBotswanaBrazilBrunei DarussalamBulgariaCambodiaCameroonCanadaCentral Europe and the BalticsChileChinaColombiaCongo, Dem. Rep.Congo, Rep.Costa RicaCote d'IvoireCroatiaCubaCuracaoCyprusCzech RepublicDenmarkDominican RepublicEarly-demographic dividendEast Asia & PacificEast Asia & Pacific (excluding high income)East Asia & Pacific (IDA & IBRD countries)EcuadorEgypt, Arab Rep.El SalvadorEritreaEstoniaEthiopiaEuro areaEurope & Central AsiaEurope & Central Asia (excluding high income)Europe & Central Asia (IDA & IBRD countries)European UnionFinlandFragile and conflict affected situationsFranceGabonGeorgiaGermanyGhanaGibraltarGreeceGuatemalaHaitiHeavily indebted poor countries (HIPC)High incomeHondurasHong Kong SAR, ChinaHungaryIBRD onlyIcelandIDA & IBRD totalIDA blendIDA onlyIDA totalIndiaIndonesiaIran, Islamic Rep.IraqIrelandIsraelItalyJamaicaJapanJordanKazakhstanKenyaKorea, Dem. People’s Rep.Korea, Rep.KosovoKuwaitKyrgyz RepublicLate-demographic dividendLatin America & Caribbean Latin America & Caribbean (excluding high income)Latin America & the Caribbean (IDA & IBRD countries)LatviaLeast developed countries: UN classificationLebanonLibyaLithuaniaLow & middle incomeLower middle incomeLuxembourgMacedonia, FYRMalaysiaMaltaMauritiusMexicoMiddle East & North AfricaMiddle East & North Africa (excluding high income)Middle East & North Africa (IDA & IBRD countries)Middle incomeMoldovaMongoliaMontenegroMoroccoMozambiqueMyanmarNamibiaNepalNetherlandsNew ZealandNicaraguaNigerNigeriaNorth AmericaNorwayOECD membersOmanOther small statesPakistanPanamaParaguayPeruPhilippinesPolandPortugalPost-demographic dividendPre-demographic dividendQatarRomaniaRussian FederationSaudi ArabiaSenegalSerbiaSingaporeSlovak RepublicSloveniaSmall statesSouth AfricaSouth AsiaSouth Asia (IDA & IBRD)South SudanSpainSri LankaSub-Saharan Africa Sub-Saharan Africa (excluding high income)Sub-Saharan Africa (IDA & IBRD countries)SudanSwedenSwitzerlandSyrian Arab RepublicTajikistanTanzaniaThailandTogoTrinidad and TobagoTunisiaTurkeyTurkmenistanUkraineUnited Arab EmiratesUnited KingdomUnited StatesUpper middle incomeUruguayUzbekistanVenezuela, RBVietnamWorldYemen, Rep.ZambiaZimbabwe Timeline:
This timeline shows a graph from 1972 to 2015 of Czech Republic. No data until 1971. Number of actual observations by date: 44.
Source name:
World Development Indicators
Source organization:
IEA Statistics © OECD/IEA 2014 (http://www.iea.org/stats/index.asp), subject to https://www.iea.org/t&c/termsandconditions/
Categories, topics:
Energy & Mining, Climate Change, Infrastructure
Last updated:
apr 23, 2017
Indicators value changes by year
Minimum:
51.309
jan 1, 2015
Maximum:
90.501
jan 1, 1984
At the date of observation
Value
Absolute change
Change from previous value
jan 1, 1972
84.843
+84.843
0.0%
jan 1, 1973
85.111
+0.268
0.32%
jan 1, 1974
85.144
+0.033
0.04%
jan 1, 1975
81.669
-3.475
-4.08%
jan 1, 1976
81.273
-0.396
-0.48%
jan 1, 1977
81.196
-0.077
-0.1%
jan 1, 1978
81.004
-0.192
-0.24%
jan 1, 1979
81.862
+0.858
1.06%
jan 1, 1980
80.526
-1.335
-1.63%
jan 1, 1981
84.75
+4.224
5.25%
jan 1, 1982
83.336
-1.414
-1.67%
jan 1, 1983
90.278
+6.941
8.33%
jan 1, 1984
90.501
+0.224
0.25%
jan 1, 1985
88.227
-2.274
-2.51%
jan 1, 1986
85.482
-2.745
-3.11%
jan 1, 1987
78.568
-6.914
-8.09%
jan 1, 1988
70.641
-7.927
-10.09%
jan 1, 1989
70.589
-0.052
-0.07%
jan 1, 1990
71.855
+1.266
1.79%
jan 1, 1991
76.44
+4.585
6.38%
jan 1, 1992
76.561
+0.121
0.16%
jan 1, 1993
75.341
-1.221
-1.59%
jan 1, 1994
74.547
-0.793
-1.05%
jan 1, 1995
73.223
-1.325
-1.78%
jan 1, 1996
74.065
+0.843
1.15%
jan 1, 1997
73.557
-0.509
-0.69%
jan 1, 1998
74.356
+0.799
1.09%
jan 1, 1999
73.584
-0.772
-1.04%
jan 1, 2000
72.147
-1.437
-1.95%
jan 1, 2001
75.391
+3.243
4.5%
jan 1, 2002
74.005
-1.385
-1.84%
jan 1, 2003
68.772
-5.234
-7.07%
jan 1, 2004
64.125
-4.646
-6.76%
jan 1, 2005
63.045
-1.081
-1.69%
jan 1, 2006
63.794
+0.749
1.19%
jan 1, 2007
62.466
-1.328
-2.08%
jan 1, 2008
64.59
+2.125
3.4%
jan 1, 2009
62.194
-2.397
-3.71%
jan 1, 2010
59.604
-2.589
-4.16%
jan 1, 2011
58.792
-0.812
-1.36%
jan 1, 2012
57.557
-1.235
-2.1%
jan 1, 2013
54.231
-3.326
-5.78%
jan 1, 2014
51.381
-2.85
-5.25%
jan 1, 2015
51.309
-0.072
-0.14%
Ranking of countries by current statistics by years


Comments: