29
/
en
AIzaSyAYiBZKx7MnpbEhh9jyipgxe19OcubqV5w
April 1, 2024
93439
Bulgaria
BGR
true
2
1
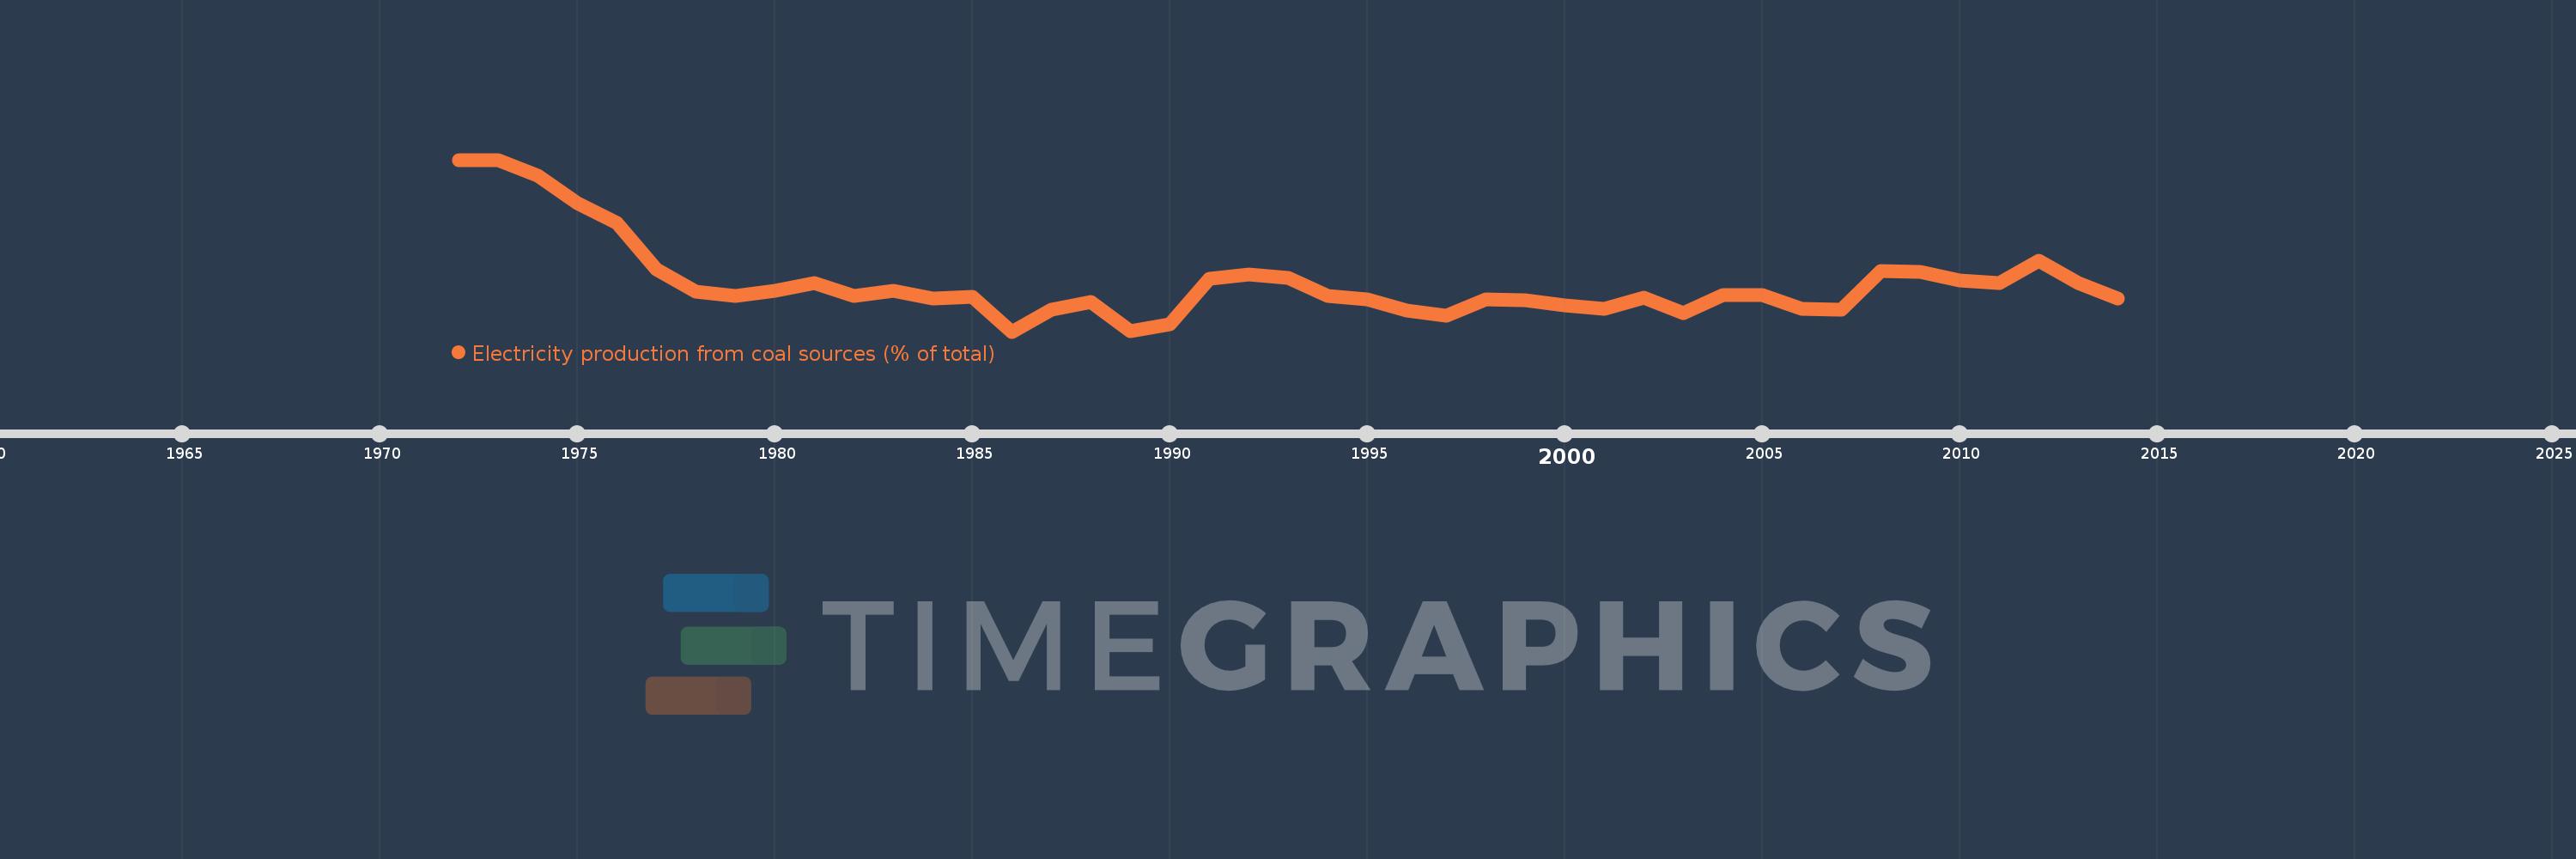
Electricity production from coal sources (% of total)
2014,2013,2012,2011,2010,2009,2008,2007,2006,2005,2004,2003,2002,2001,2000,1999,1998,1997,1996,1995,1994,1993,1992,1991,1990,1989,1988,1987,1986,1985,1984,1983,1982,1981,1980,1979,1978,1977,1976,1975,1974,1973,1972
This statistics in other country:
AlbaniaAlgeriaAngolaArab WorldArgentinaArmeniaAustraliaAustriaAzerbaijanBahrainBangladeshBelarusBelgiumBeninBoliviaBosnia and HerzegovinaBotswanaBrazilBrunei DarussalamBulgariaCambodiaCameroonCanadaCentral Europe and the BalticsChileChinaColombiaCongo, Dem. Rep.Congo, Rep.Costa RicaCote d'IvoireCroatiaCubaCuracaoCyprusCzech RepublicDenmarkDominican RepublicEarly-demographic dividendEast Asia & PacificEast Asia & Pacific (excluding high income)East Asia & Pacific (IDA & IBRD countries)EcuadorEgypt, Arab Rep.El SalvadorEritreaEstoniaEthiopiaEuro areaEurope & Central AsiaEurope & Central Asia (excluding high income)Europe & Central Asia (IDA & IBRD countries)European UnionFinlandFragile and conflict affected situationsFranceGabonGeorgiaGermanyGhanaGibraltarGreeceGuatemalaHaitiHeavily indebted poor countries (HIPC)High incomeHondurasHong Kong SAR, ChinaHungaryIBRD onlyIcelandIDA & IBRD totalIDA blendIDA onlyIDA totalIndiaIndonesiaIran, Islamic Rep.IraqIrelandIsraelItalyJamaicaJapanJordanKazakhstanKenyaKorea, Dem. People’s Rep.Korea, Rep.KosovoKuwaitKyrgyz RepublicLate-demographic dividendLatin America & Caribbean Latin America & Caribbean (excluding high income)Latin America & the Caribbean (IDA & IBRD countries)LatviaLeast developed countries: UN classificationLebanonLibyaLithuaniaLow & middle incomeLower middle incomeLuxembourgMacedonia, FYRMalaysiaMaltaMauritiusMexicoMiddle East & North AfricaMiddle East & North Africa (excluding high income)Middle East & North Africa (IDA & IBRD countries)Middle incomeMoldovaMongoliaMontenegroMoroccoMozambiqueMyanmarNamibiaNepalNetherlandsNew ZealandNicaraguaNigerNigeriaNorth AmericaNorwayOECD membersOmanOther small statesPakistanPanamaParaguayPeruPhilippinesPolandPortugalPost-demographic dividendPre-demographic dividendQatarRomaniaRussian FederationSaudi ArabiaSenegalSerbiaSingaporeSlovak RepublicSloveniaSmall statesSouth AfricaSouth AsiaSouth Asia (IDA & IBRD)South SudanSpainSri LankaSub-Saharan Africa Sub-Saharan Africa (excluding high income)Sub-Saharan Africa (IDA & IBRD countries)SudanSwedenSwitzerlandSyrian Arab RepublicTajikistanTanzaniaThailandTogoTrinidad and TobagoTunisiaTurkeyTurkmenistanUkraineUnited Arab EmiratesUnited KingdomUnited StatesUpper middle incomeUruguayUzbekistanVenezuela, RBVietnamWorldYemen, Rep.ZambiaZimbabwe Timeline:
This timeline shows a graph from 1972 to 2014 of Bulgaria. No data until 1971. Number of actual observations by date: 43.
Source name:
World Development Indicators
Source organization:
IEA Statistics © OECD/IEA 2014 (http://www.iea.org/stats/index.asp), subject to https://www.iea.org/t&c/termsandconditions/
Categories, topics:
Energy & Mining, Climate Change, Infrastructure
Last updated:
apr 23, 2017
Indicators value changes by year
Minimum:
36.448
jan 1, 1986
Maximum:
81.505
jan 1, 1972
At the date of observation
Value
Absolute change
Change from previous value
jan 1, 1972
81.505
+81.505
0.0%
jan 1, 1973
81.388
-0.116
-0.14%
jan 1, 1974
77.277
-4.111
-5.05%
jan 1, 1975
70.157
-7.12
-9.21%
jan 1, 1976
64.873
-5.284
-7.53%
jan 1, 1977
52.762
-12.111
-18.67%
jan 1, 1978
47.028
-5.735
-10.87%
jan 1, 1979
45.866
-1.162
-2.47%
jan 1, 1980
47.253
+1.388
3.03%
jan 1, 1981
49.152
+1.898
4.02%
jan 1, 1982
45.791
-3.36
-6.84%
jan 1, 1983
47.038
+1.246
2.72%
jan 1, 1984
45.064
-1.973
-4.2%
jan 1, 1985
45.559
+0.494
1.1%
jan 1, 1986
36.448
-9.111
-20.0%
jan 1, 1987
42.102
+5.654
15.51%
jan 1, 1988
44.165
+2.063
4.9%
jan 1, 1989
36.581
-7.585
-17.17%
jan 1, 1990
38.262
+1.682
4.6%
jan 1, 1991
50.26
+11.997
31.36%
jan 1, 1992
51.392
+1.133
2.25%
jan 1, 1993
50.593
-0.8
-1.56%
jan 1, 1994
45.788
-4.805
-9.5%
jan 1, 1995
44.969
-0.819
-1.79%
jan 1, 1996
42.023
-2.946
-6.55%
jan 1, 1997
40.727
-1.296
-3.08%
jan 1, 1998
44.997
+4.269
10.48%
jan 1, 1999
44.758
-0.239
-0.53%
jan 1, 2000
43.363
-1.396
-3.12%
jan 1, 2001
42.334
-1.029
-2.37%
jan 1, 2002
45.383
+3.049
7.2%
jan 1, 2003
41.199
-4.184
-9.22%
jan 1, 2004
45.979
+4.781
11.6%
jan 1, 2005
46.123
+0.144
0.31%
jan 1, 2006
42.356
-3.767
-8.17%
jan 1, 2007
42.209
-0.147
-0.35%
jan 1, 2008
52.316
+10.107
23.95%
jan 1, 2009
52.081
-0.235
-0.45%
jan 1, 2010
49.794
-2.288
-4.39%
jan 1, 2011
49.125
-0.668
-1.34%
jan 1, 2012
55.049
+5.923
12.06%
jan 1, 2013
49.112
-5.936
-10.78%
jan 1, 2014
45.025
-4.087
-8.32%
Ranking of countries by current statistics by years


Comments: