29
/
en
AIzaSyAYiBZKx7MnpbEhh9jyipgxe19OcubqV5w
April 1, 2024
201443
Morocco
MAR
true
2
1
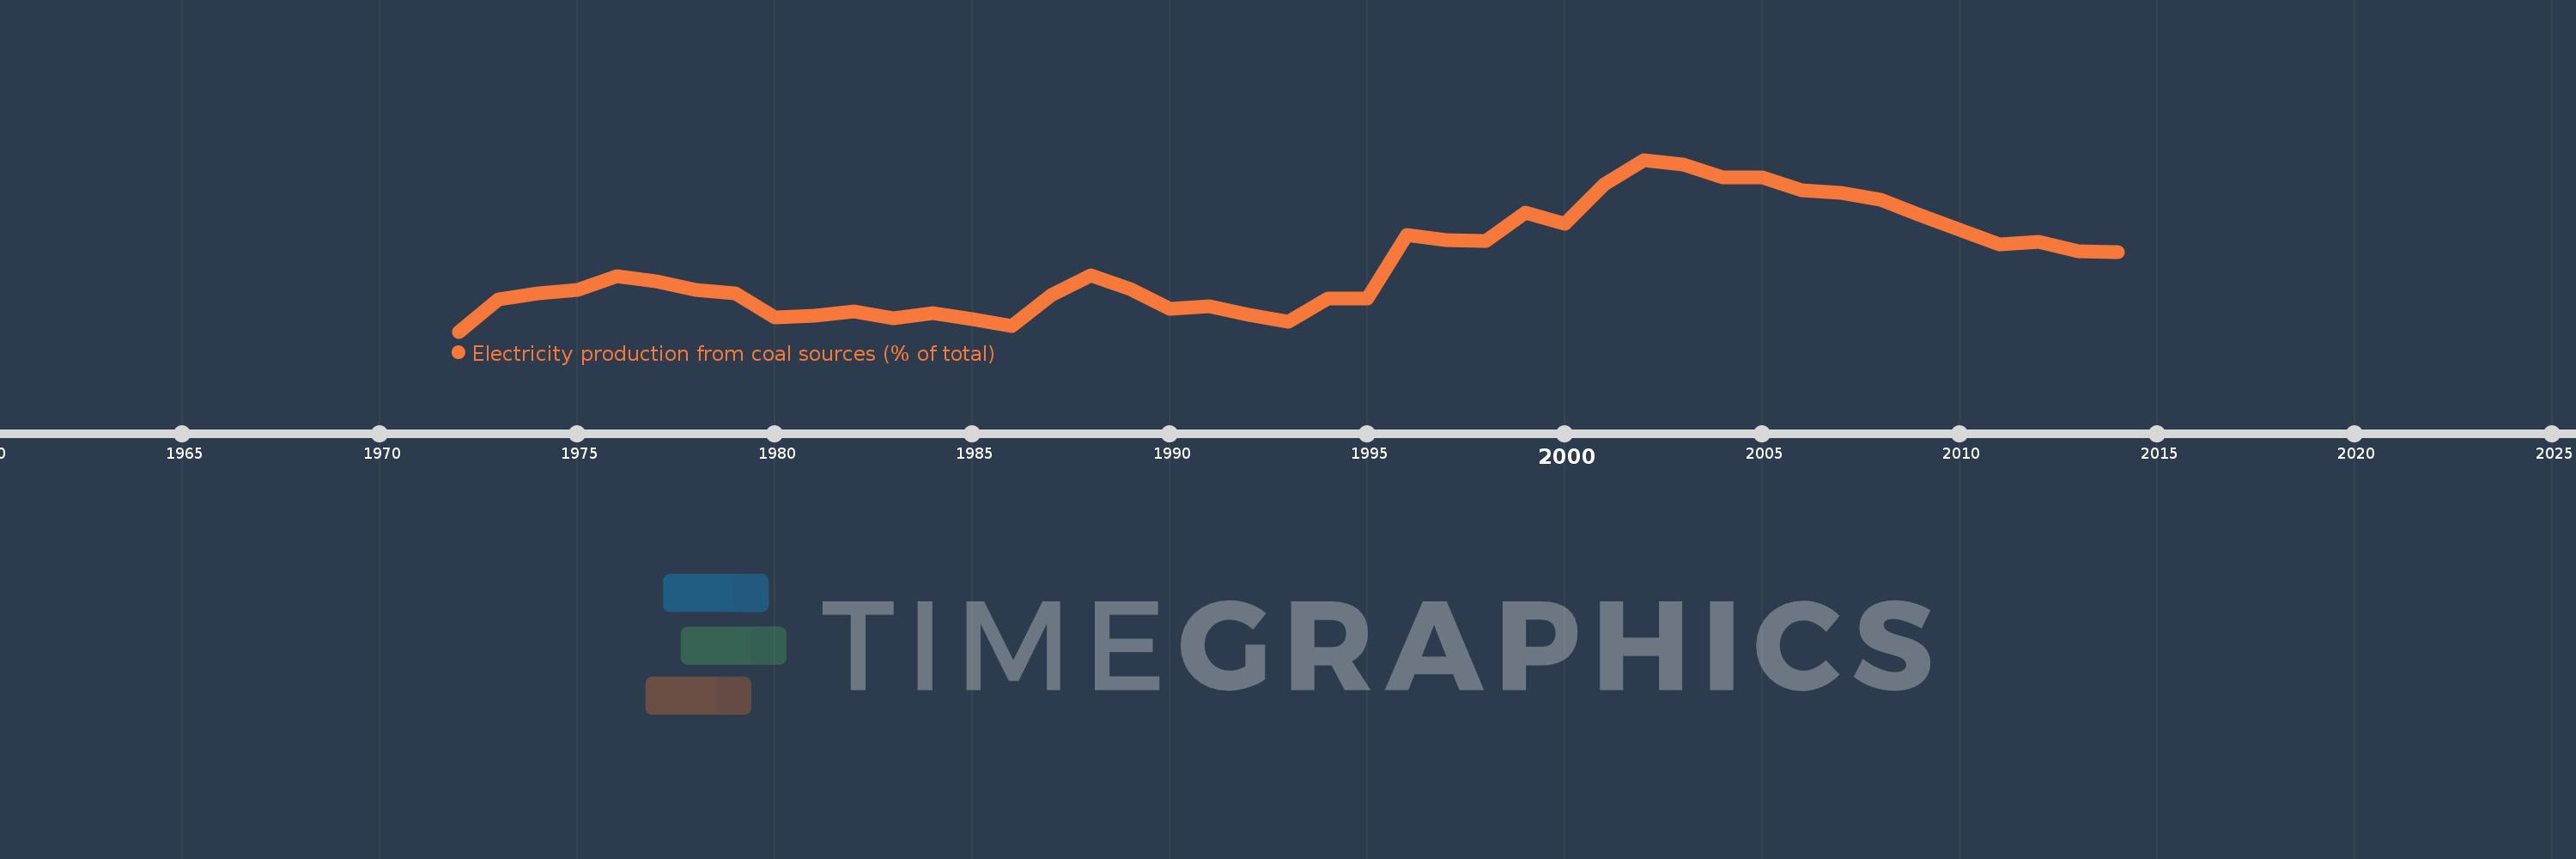
Electricity production from coal sources (% of total)
2014,2013,2012,2011,2010,2009,2008,2007,2006,2005,2004,2003,2002,2001,2000,1999,1998,1997,1996,1995,1994,1993,1992,1991,1990,1989,1988,1987,1986,1985,1984,1983,1982,1981,1980,1979,1978,1977,1976,1975,1974,1973,1972
This statistics in other country:
AlbaniaAlgeriaAngolaArab WorldArgentinaArmeniaAustraliaAustriaAzerbaijanBahrainBangladeshBelarusBelgiumBeninBoliviaBosnia and HerzegovinaBotswanaBrazilBrunei DarussalamBulgariaCambodiaCameroonCanadaCentral Europe and the BalticsChileChinaColombiaCongo, Dem. Rep.Congo, Rep.Costa RicaCote d'IvoireCroatiaCubaCuracaoCyprusCzech RepublicDenmarkDominican RepublicEarly-demographic dividendEast Asia & PacificEast Asia & Pacific (excluding high income)East Asia & Pacific (IDA & IBRD countries)EcuadorEgypt, Arab Rep.El SalvadorEritreaEstoniaEthiopiaEuro areaEurope & Central AsiaEurope & Central Asia (excluding high income)Europe & Central Asia (IDA & IBRD countries)European UnionFinlandFragile and conflict affected situationsFranceGabonGeorgiaGermanyGhanaGibraltarGreeceGuatemalaHaitiHeavily indebted poor countries (HIPC)High incomeHondurasHong Kong SAR, ChinaHungaryIBRD onlyIcelandIDA & IBRD totalIDA blendIDA onlyIDA totalIndiaIndonesiaIran, Islamic Rep.IraqIrelandIsraelItalyJamaicaJapanJordanKazakhstanKenyaKorea, Dem. People’s Rep.Korea, Rep.KosovoKuwaitKyrgyz RepublicLate-demographic dividendLatin America & Caribbean Latin America & Caribbean (excluding high income)Latin America & the Caribbean (IDA & IBRD countries)LatviaLeast developed countries: UN classificationLebanonLibyaLithuaniaLow & middle incomeLower middle incomeLuxembourgMacedonia, FYRMalaysiaMaltaMauritiusMexicoMiddle East & North AfricaMiddle East & North Africa (excluding high income)Middle East & North Africa (IDA & IBRD countries)Middle incomeMoldovaMongoliaMontenegroMoroccoMozambiqueMyanmarNamibiaNepalNetherlandsNew ZealandNicaraguaNigerNigeriaNorth AmericaNorwayOECD membersOmanOther small statesPakistanPanamaParaguayPeruPhilippinesPolandPortugalPost-demographic dividendPre-demographic dividendQatarRomaniaRussian FederationSaudi ArabiaSenegalSerbiaSingaporeSlovak RepublicSloveniaSmall statesSouth AfricaSouth AsiaSouth Asia (IDA & IBRD)South SudanSpainSri LankaSub-Saharan Africa Sub-Saharan Africa (excluding high income)Sub-Saharan Africa (IDA & IBRD countries)SudanSwedenSwitzerlandSyrian Arab RepublicTajikistanTanzaniaThailandTogoTrinidad and TobagoTunisiaTurkeyTurkmenistanUkraineUnited Arab EmiratesUnited KingdomUnited StatesUpper middle incomeUruguayUzbekistanVenezuela, RBVietnamWorldYemen, Rep.ZambiaZimbabwe Timeline:
This timeline shows a graph from 1972 to 2014 of Morocco. No data until 1971. Number of actual observations by date: 43.
Source name:
World Development Indicators
Source organization:
IEA Statistics © OECD/IEA 2014 (http://www.iea.org/stats/index.asp), subject to https://www.iea.org/t&c/termsandconditions/
Categories, topics:
Energy & Mining, Climate Change, Infrastructure
Last updated:
apr 23, 2017
Indicators value changes by year
Minimum:
13.406
jan 1, 1972
Maximum:
77.356
jan 1, 2002
At the date of observation
Value
Absolute change
Change from previous value
jan 1, 1972
13.406
+13.406
0.0%
jan 1, 1973
25.478
+12.072
90.05%
jan 1, 1974
27.513
+2.035
7.99%
jan 1, 1975
28.781
+1.268
4.61%
jan 1, 1976
34.108
+5.327
18.51%
jan 1, 1977
31.993
-2.115
-6.2%
jan 1, 1978
29.006
-2.987
-9.34%
jan 1, 1979
27.735
-1.272
-4.38%
jan 1, 1980
18.798
-8.937
-32.22%
jan 1, 1981
19.478
+0.68
3.62%
jan 1, 1982
20.88
+1.402
7.2%
jan 1, 1983
18.226
-2.654
-12.71%
jan 1, 1984
20.401
+2.175
11.93%
jan 1, 1985
18.191
-2.21
-10.83%
jan 1, 1986
15.575
-2.616
-14.38%
jan 1, 1987
27.074
+11.498
73.83%
jan 1, 1988
34.346
+7.272
26.86%
jan 1, 1989
29.185
-5.16
-15.03%
jan 1, 1990
21.919
-7.266
-24.9%
jan 1, 1991
22.975
+1.055
4.81%
jan 1, 1992
19.728
-3.246
-14.13%
jan 1, 1993
17.162
-2.566
-13.01%
jan 1, 1994
25.58
+8.418
49.05%
jan 1, 1995
25.615
+0.034
0.13%
jan 1, 1996
49.355
+23.74
92.68%
jan 1, 1997
47.368
-1.987
-4.03%
jan 1, 1998
47.105
-0.263
-0.55%
jan 1, 1999
57.619
+10.514
22.32%
jan 1, 2000
53.571
-4.048
-7.02%
jan 1, 2001
68.281
+14.71
27.46%
jan 1, 2002
77.356
+9.075
13.29%
jan 1, 2003
75.596
-1.76
-2.28%
jan 1, 2004
70.883
-4.713
-6.23%
jan 1, 2005
70.709
-0.174
-0.25%
jan 1, 2006
65.998
-4.711
-6.66%
jan 1, 2007
64.952
-1.046
-1.59%
jan 1, 2008
62.607
-2.344
-3.61%
jan 1, 2009
56.722
-5.886
-9.4%
jan 1, 2010
51.374
-5.348
-9.43%
jan 1, 2011
45.902
-5.472
-10.65%
jan 1, 2012
46.705
+0.802
1.75%
jan 1, 2013
43.373
-3.332
-7.13%
jan 1, 2014
43.074
-0.299
-0.69%
Ranking of countries by current statistics by years


Comments: