29
/
en
AIzaSyAYiBZKx7MnpbEhh9jyipgxe19OcubqV5w
April 1, 2024
152415
Hungary
HUN
true
2
1
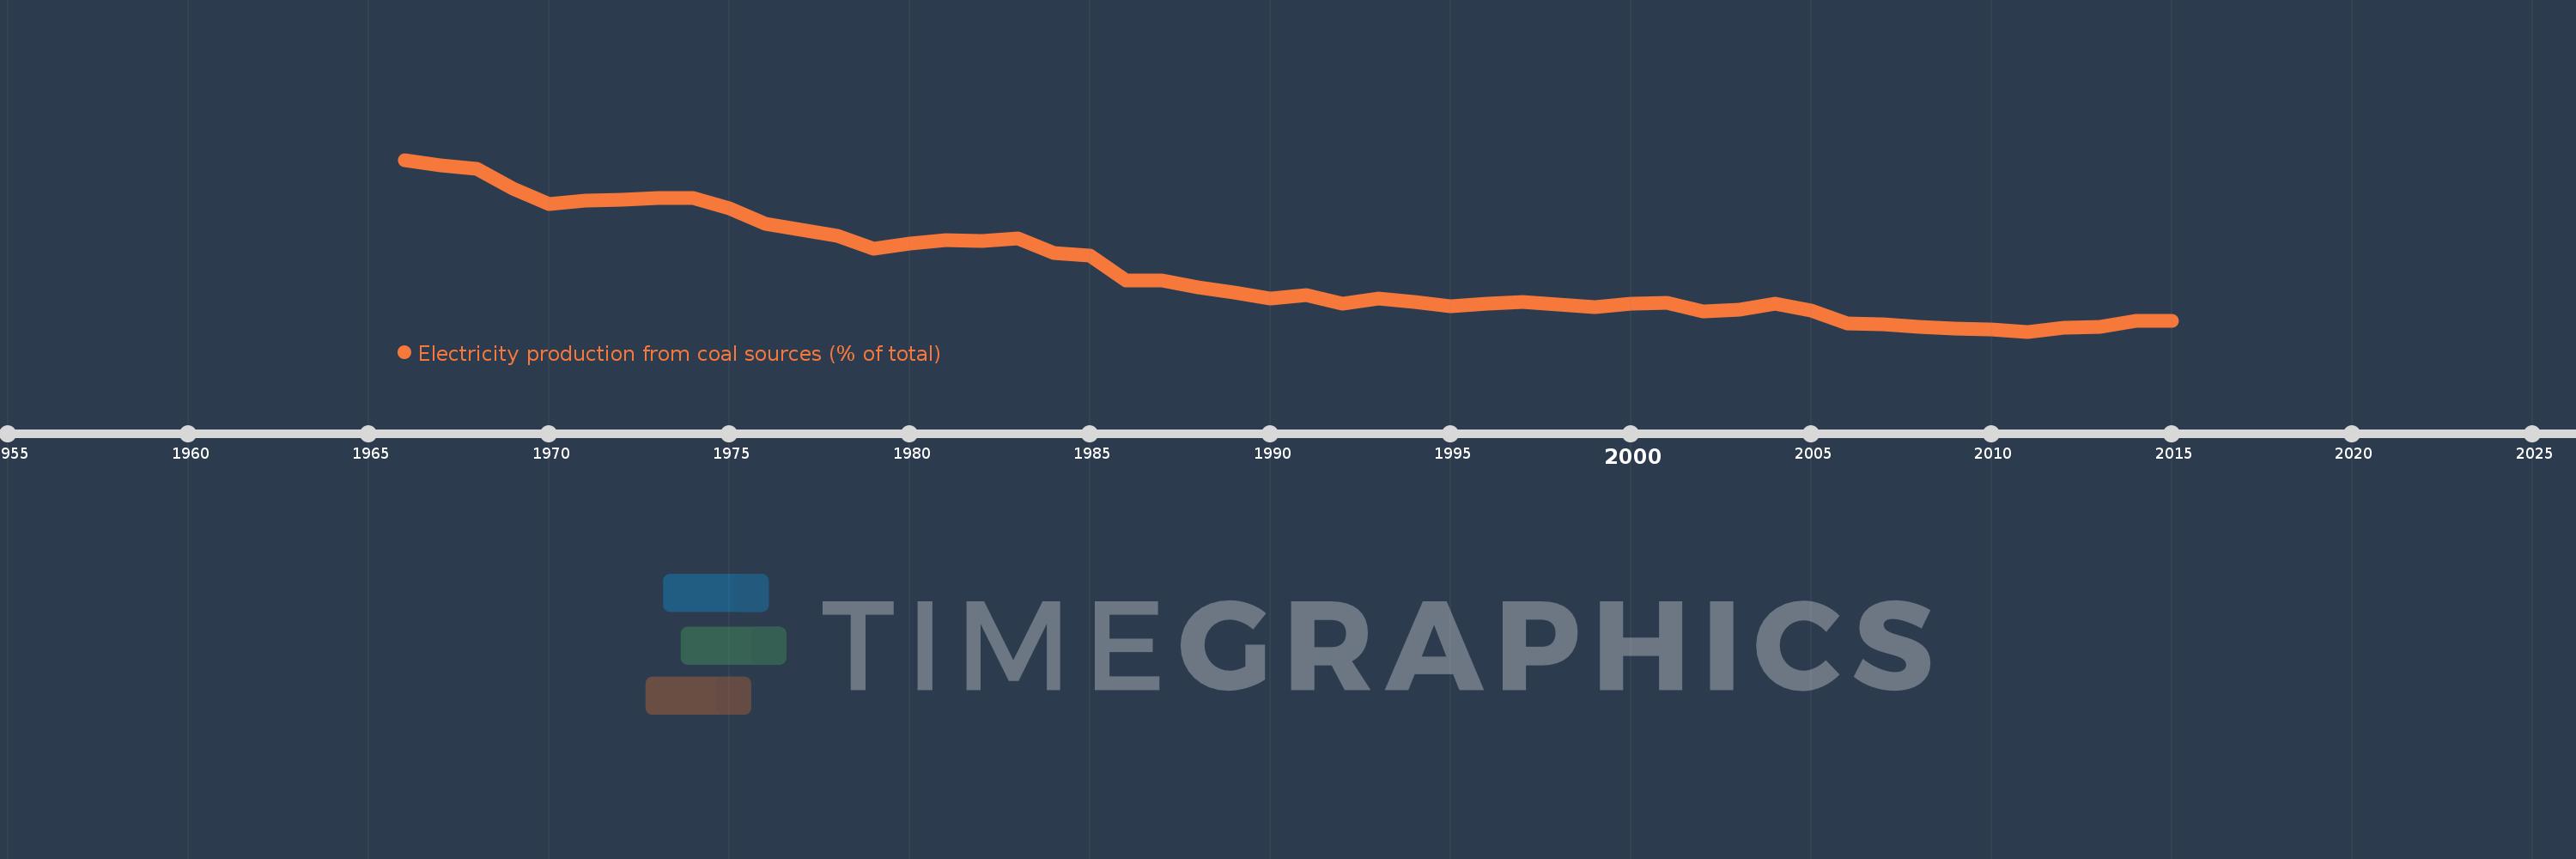
Electricity production from coal sources (% of total)
2015,2014,2013,2012,2011,2010,2009,2008,2007,2006,2005,2004,2003,2002,2001,2000,1999,1998,1997,1996,1995,1994,1993,1992,1991,1990,1989,1988,1987,1986,1985,1984,1983,1982,1981,1980,1979,1978,1977,1976,1975,1974,1973,1972,1971,1970,1969,1968,1967,1966
This statistics in other country:
AlbaniaAlgeriaAngolaArab WorldArgentinaArmeniaAustraliaAustriaAzerbaijanBahrainBangladeshBelarusBelgiumBeninBoliviaBosnia and HerzegovinaBotswanaBrazilBrunei DarussalamBulgariaCambodiaCameroonCanadaCentral Europe and the BalticsChileChinaColombiaCongo, Dem. Rep.Congo, Rep.Costa RicaCote d'IvoireCroatiaCubaCuracaoCyprusCzech RepublicDenmarkDominican RepublicEarly-demographic dividendEast Asia & PacificEast Asia & Pacific (excluding high income)East Asia & Pacific (IDA & IBRD countries)EcuadorEgypt, Arab Rep.El SalvadorEritreaEstoniaEthiopiaEuro areaEurope & Central AsiaEurope & Central Asia (excluding high income)Europe & Central Asia (IDA & IBRD countries)European UnionFinlandFragile and conflict affected situationsFranceGabonGeorgiaGermanyGhanaGibraltarGreeceGuatemalaHaitiHeavily indebted poor countries (HIPC)High incomeHondurasHong Kong SAR, ChinaHungaryIBRD onlyIcelandIDA & IBRD totalIDA blendIDA onlyIDA totalIndiaIndonesiaIran, Islamic Rep.IraqIrelandIsraelItalyJamaicaJapanJordanKazakhstanKenyaKorea, Dem. People’s Rep.Korea, Rep.KosovoKuwaitKyrgyz RepublicLate-demographic dividendLatin America & Caribbean Latin America & Caribbean (excluding high income)Latin America & the Caribbean (IDA & IBRD countries)LatviaLeast developed countries: UN classificationLebanonLibyaLithuaniaLow & middle incomeLower middle incomeLuxembourgMacedonia, FYRMalaysiaMaltaMauritiusMexicoMiddle East & North AfricaMiddle East & North Africa (excluding high income)Middle East & North Africa (IDA & IBRD countries)Middle incomeMoldovaMongoliaMontenegroMoroccoMozambiqueMyanmarNamibiaNepalNetherlandsNew ZealandNicaraguaNigerNigeriaNorth AmericaNorwayOECD membersOmanOther small statesPakistanPanamaParaguayPeruPhilippinesPolandPortugalPost-demographic dividendPre-demographic dividendQatarRomaniaRussian FederationSaudi ArabiaSenegalSerbiaSingaporeSlovak RepublicSloveniaSmall statesSouth AfricaSouth AsiaSouth Asia (IDA & IBRD)South SudanSpainSri LankaSub-Saharan Africa Sub-Saharan Africa (excluding high income)Sub-Saharan Africa (IDA & IBRD countries)SudanSwedenSwitzerlandSyrian Arab RepublicTajikistanTanzaniaThailandTogoTrinidad and TobagoTunisiaTurkeyTurkmenistanUkraineUnited Arab EmiratesUnited KingdomUnited StatesUpper middle incomeUruguayUzbekistanVenezuela, RBVietnamWorldYemen, Rep.ZambiaZimbabwe Timeline:
This timeline shows a graph from 1966 to 2015 of Hungary. No data until 1965. Number of actual observations by date: 50.
Source name:
World Development Indicators
Source organization:
IEA Statistics © OECD/IEA 2014 (http://www.iea.org/stats/index.asp), subject to https://www.iea.org/t&c/termsandconditions/
Categories, topics:
Energy & Mining, Climate Change, Infrastructure
Last updated:
apr 23, 2017
Indicators value changes by year
Minimum:
16.992
jan 1, 2011
Maximum:
80.075
jan 1, 1966
At the date of observation
Value
Absolute change
Change from previous value
jan 1, 1966
80.075
+80.075
0.0%
jan 1, 1967
77.928
-2.147
-2.68%
jan 1, 1968
76.637
-1.29
-1.66%
jan 1, 1969
69.494
-7.143
-9.32%
jan 1, 1970
63.779
-5.716
-8.23%
jan 1, 1971
65.032
+1.254
1.97%
jan 1, 1972
65.353
+0.32
0.49%
jan 1, 1973
65.938
+0.585
0.89%
jan 1, 1974
66.015
+0.077
0.12%
jan 1, 1975
62.281
-3.734
-5.66%
jan 1, 1976
56.477
-5.804
-9.32%
jan 1, 1977
54.444
-2.033
-3.6%
jan 1, 1978
52.008
-2.436
-4.47%
jan 1, 1979
47.516
-4.492
-8.64%
jan 1, 1980
49.235
+1.719
3.62%
jan 1, 1981
50.436
+1.2
2.44%
jan 1, 1982
50.391
-0.045
-0.09%
jan 1, 1983
51.217
+0.826
1.64%
jan 1, 1984
45.805
-5.412
-10.57%
jan 1, 1985
45.056
-0.749
-1.63%
jan 1, 1986
35.83
-9.226
-20.48%
jan 1, 1987
35.822
-0.008
-0.02%
jan 1, 1988
33.349
-2.473
-6.9%
jan 1, 1989
31.423
-1.926
-5.77%
jan 1, 1990
29.272
-2.151
-6.85%
jan 1, 1991
30.486
+1.214
4.15%
jan 1, 1992
27.174
-3.312
-10.87%
jan 1, 1993
29.276
+2.102
7.74%
jan 1, 1994
27.86
-1.416
-4.84%
jan 1, 1995
26.43
-1.43
-5.13%
jan 1, 1996
27.133
+0.703
2.66%
jan 1, 1997
27.72
+0.587
2.17%
jan 1, 1998
26.872
-0.848
-3.06%
jan 1, 1999
26.061
-0.812
-3.02%
jan 1, 2000
27.241
+1.181
4.53%
jan 1, 2001
27.584
+0.342
1.26%
jan 1, 2002
24.504
-3.08
-11.17%
jan 1, 2003
25.066
+0.562
2.29%
jan 1, 2004
27.102
+2.036
8.12%
jan 1, 2005
24.739
-2.363
-8.72%
jan 1, 2006
19.985
-4.753
-19.21%
jan 1, 2007
19.777
-0.208
-1.04%
jan 1, 2008
18.736
-1.041
-5.26%
jan 1, 2009
18.001
-0.735
-3.92%
jan 1, 2010
17.865
-0.136
-0.76%
jan 1, 2011
16.992
-0.873
-4.89%
jan 1, 2012
18.349
+1.357
7.99%
jan 1, 2013
18.749
+0.4
2.18%
jan 1, 2014
21.088
+2.339
12.48%
jan 1, 2015
20.841
-0.247
-1.17%
Ranking of countries by current statistics by years


Comments: