29
/
en
AIzaSyAYiBZKx7MnpbEhh9jyipgxe19OcubqV5w
April 1, 2024
34161
Fragile and conflict affected situations
FCS
false
2
1
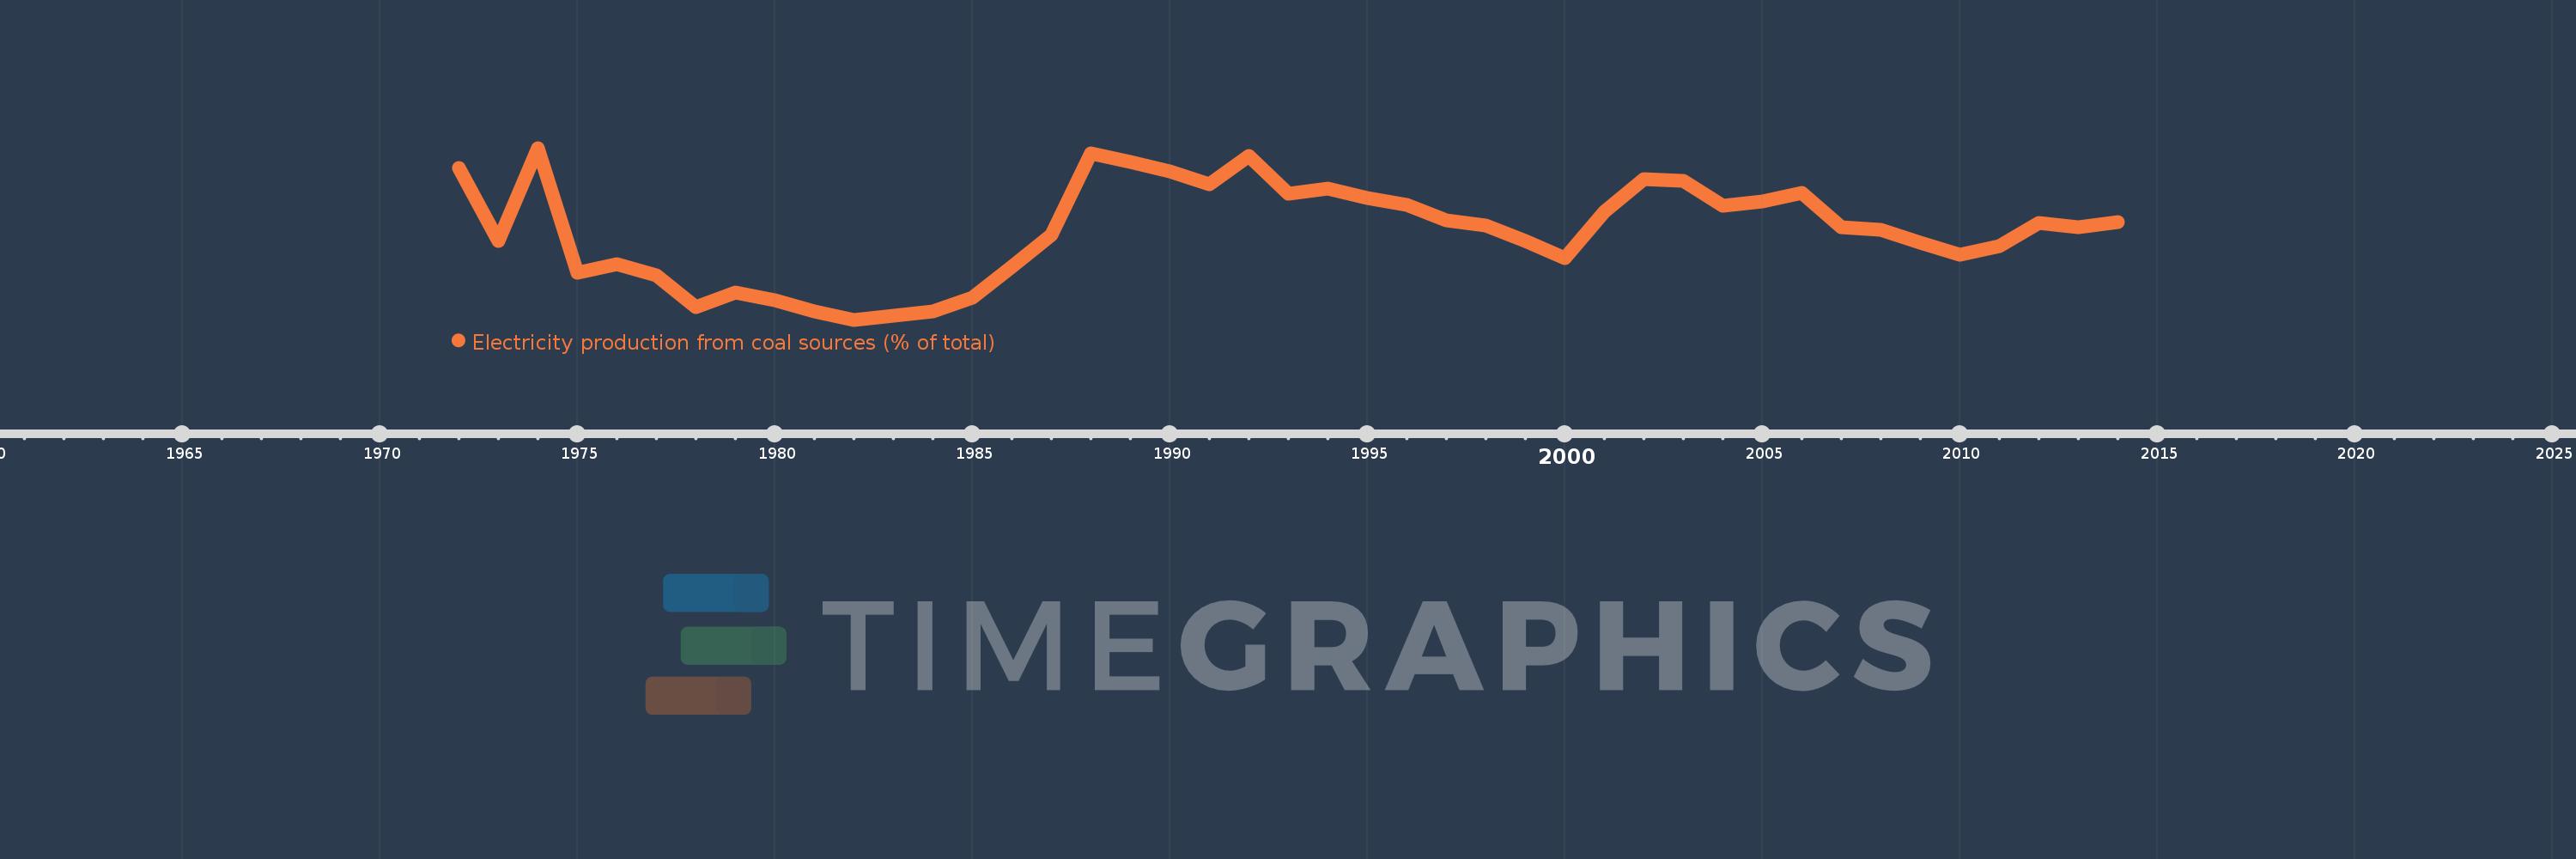
Electricity production from coal sources (% of total)
2014,2013,2012,2011,2010,2009,2008,2007,2006,2005,2004,2003,2002,2001,2000,1999,1998,1997,1996,1995,1994,1993,1992,1991,1990,1989,1988,1987,1986,1985,1984,1983,1982,1981,1980,1979,1978,1977,1976,1975,1974,1973,1972
This statistics in other country:
AlbaniaAlgeriaAngolaArab WorldArgentinaArmeniaAustraliaAustriaAzerbaijanBahrainBangladeshBelarusBelgiumBeninBoliviaBosnia and HerzegovinaBotswanaBrazilBrunei DarussalamBulgariaCambodiaCameroonCanadaCentral Europe and the BalticsChileChinaColombiaCongo, Dem. Rep.Congo, Rep.Costa RicaCote d'IvoireCroatiaCubaCuracaoCyprusCzech RepublicDenmarkDominican RepublicEarly-demographic dividendEast Asia & PacificEast Asia & Pacific (excluding high income)East Asia & Pacific (IDA & IBRD countries)EcuadorEgypt, Arab Rep.El SalvadorEritreaEstoniaEthiopiaEuro areaEurope & Central AsiaEurope & Central Asia (excluding high income)Europe & Central Asia (IDA & IBRD countries)European UnionFinlandFragile and conflict affected situationsFranceGabonGeorgiaGermanyGhanaGibraltarGreeceGuatemalaHaitiHeavily indebted poor countries (HIPC)High incomeHondurasHong Kong SAR, ChinaHungaryIBRD onlyIcelandIDA & IBRD totalIDA blendIDA onlyIDA totalIndiaIndonesiaIran, Islamic Rep.IraqIrelandIsraelItalyJamaicaJapanJordanKazakhstanKenyaKorea, Dem. People’s Rep.Korea, Rep.KosovoKuwaitKyrgyz RepublicLate-demographic dividendLatin America & Caribbean Latin America & Caribbean (excluding high income)Latin America & the Caribbean (IDA & IBRD countries)LatviaLeast developed countries: UN classificationLebanonLibyaLithuaniaLow & middle incomeLower middle incomeLuxembourgMacedonia, FYRMalaysiaMaltaMauritiusMexicoMiddle East & North AfricaMiddle East & North Africa (excluding high income)Middle East & North Africa (IDA & IBRD countries)Middle incomeMoldovaMongoliaMontenegroMoroccoMozambiqueMyanmarNamibiaNepalNetherlandsNew ZealandNicaraguaNigerNigeriaNorth AmericaNorwayOECD membersOmanOther small statesPakistanPanamaParaguayPeruPhilippinesPolandPortugalPost-demographic dividendPre-demographic dividendQatarRomaniaRussian FederationSaudi ArabiaSenegalSerbiaSingaporeSlovak RepublicSloveniaSmall statesSouth AfricaSouth AsiaSouth Asia (IDA & IBRD)South SudanSpainSri LankaSub-Saharan Africa Sub-Saharan Africa (excluding high income)Sub-Saharan Africa (IDA & IBRD countries)SudanSwedenSwitzerlandSyrian Arab RepublicTajikistanTanzaniaThailandTogoTrinidad and TobagoTunisiaTurkeyTurkmenistanUkraineUnited Arab EmiratesUnited KingdomUnited StatesUpper middle incomeUruguayUzbekistanVenezuela, RBVietnamWorldYemen, Rep.ZambiaZimbabwe Timeline:
This timeline shows a graph from 1972 to 2014 of Fragile and conflict affected situations. No data until 1971. Number of actual observations by date: 43.
Source name:
World Development Indicators
Source organization:
IEA Statistics © OECD/IEA 2014 (http://www.iea.org/stats/index.asp), subject to https://www.iea.org/t&c/termsandconditions/
Categories, topics:
Energy & Mining, Climate Change, Infrastructure
Last updated:
apr 23, 2017
Indicators value changes by year
At the date of observation
Value
Absolute change
Change from previous value
jan 1, 1972
6.528
+6.528
0.0%
jan 1, 1973
3.842
-2.686
-41.15%
jan 1, 1974
7.28
+3.439
89.51%
jan 1, 1975
2.691
-4.589
-63.04%
jan 1, 1976
3.014
+0.323
12.01%
jan 1, 1977
2.581
-0.433
-14.37%
jan 1, 1978
1.432
-1.149
-44.51%
jan 1, 1979
1.964
+0.532
37.12%
jan 1, 1980
1.67
-0.294
-14.97%
jan 1, 1981
1.274
-0.395
-23.68%
jan 1, 1982
0.958
-0.316
-24.83%
jan 1, 1983
1.099
+0.141
14.73%
jan 1, 1984
1.275
+0.176
16.02%
jan 1, 1985
1.784
+0.508
39.87%
jan 1, 1986
2.917
+1.133
63.55%
jan 1, 1987
4.082
+1.165
39.95%
jan 1, 1988
7.089
+3.007
73.65%
jan 1, 1989
6.779
-0.31
-4.37%
jan 1, 1990
6.427
-0.352
-5.2%
jan 1, 1991
5.942
-0.485
-7.54%
jan 1, 1992
6.988
+1.046
17.6%
jan 1, 1993
5.585
-1.403
-20.08%
jan 1, 1994
5.786
+0.202
3.61%
jan 1, 1995
5.448
-0.338
-5.84%
jan 1, 1996
5.173
-0.275
-5.04%
jan 1, 1997
4.608
-0.565
-10.92%
jan 1, 1998
4.426
-0.183
-3.96%
jan 1, 1999
3.845
-0.581
-13.13%
jan 1, 2000
3.226
-0.618
-16.08%
jan 1, 2001
4.938
+1.712
53.05%
jan 1, 2002
6.141
+1.203
24.36%
jan 1, 2003
6.08
-0.061
-1.0%
jan 1, 2004
5.156
-0.924
-15.2%
jan 1, 2005
5.32
+0.164
3.18%
jan 1, 2006
5.611
+0.291
5.48%
jan 1, 2007
4.367
-1.244
-22.18%
jan 1, 2008
4.28
-0.087
-1.99%
jan 1, 2009
3.805
-0.475
-11.09%
jan 1, 2010
3.35
-0.455
-11.95%
jan 1, 2011
3.678
+0.327
9.77%
jan 1, 2012
4.515
+0.838
22.77%
jan 1, 2013
4.354
-0.162
-3.58%
jan 1, 2014
4.558
+0.205
4.7%
Ranking of countries by current statistics by years


Comments: