29
/
en
AIzaSyAYiBZKx7MnpbEhh9jyipgxe19OcubqV5w
April 1, 2024
73804
Austria
AUT
true
2
1
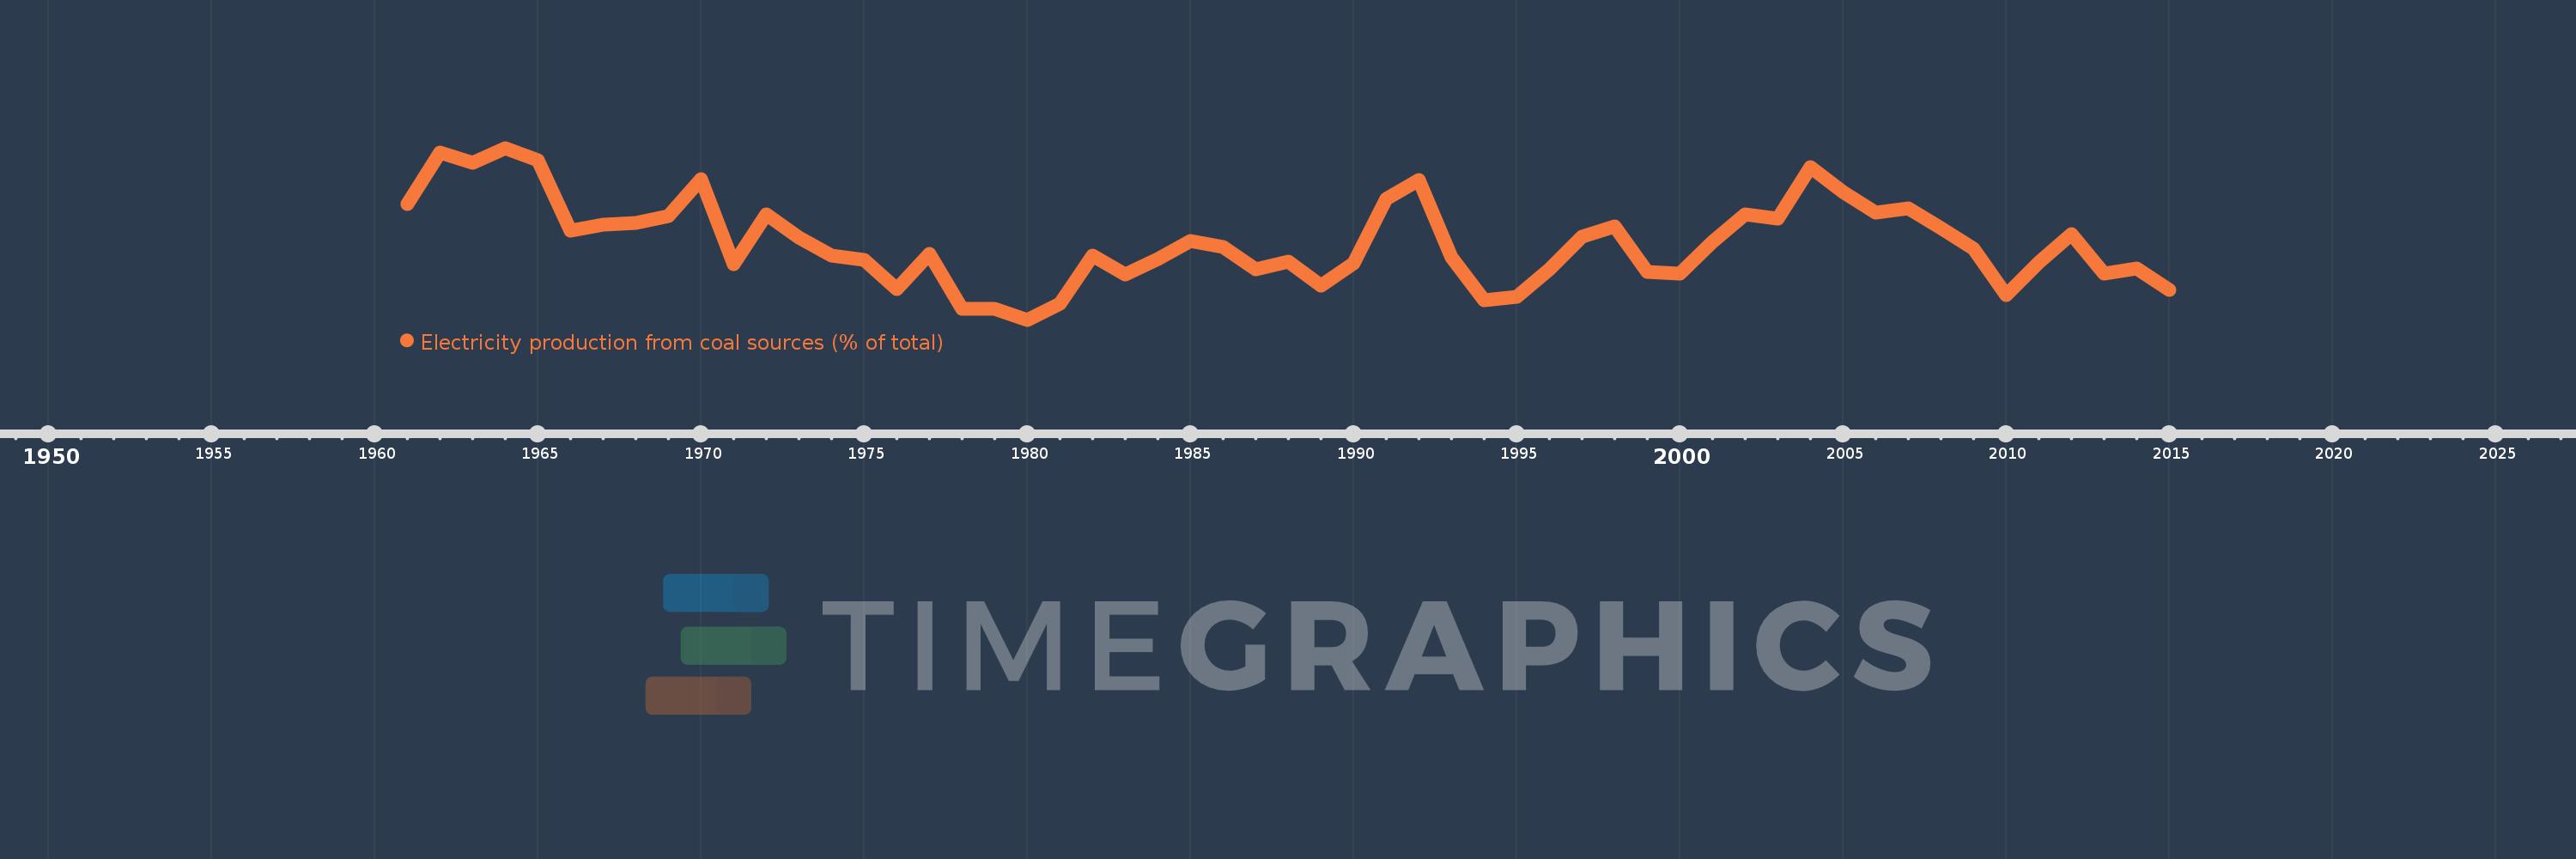
Electricity production from coal sources (% of total)
2015,2014,2013,2012,2011,2010,2009,2008,2007,2006,2005,2004,2003,2002,2001,2000,1999,1998,1997,1996,1995,1994,1993,1992,1991,1990,1989,1988,1987,1986,1985,1984,1983,1982,1981,1980,1979,1978,1977,1976,1975,1974,1973,1972,1971,1970,1969,1968,1967,1966,1965,1964,1963,1962,1961
This statistics in other country:
AlbaniaAlgeriaAngolaArab WorldArgentinaArmeniaAustraliaAustriaAzerbaijanBahrainBangladeshBelarusBelgiumBeninBoliviaBosnia and HerzegovinaBotswanaBrazilBrunei DarussalamBulgariaCambodiaCameroonCanadaCentral Europe and the BalticsChileChinaColombiaCongo, Dem. Rep.Congo, Rep.Costa RicaCote d'IvoireCroatiaCubaCuracaoCyprusCzech RepublicDenmarkDominican RepublicEarly-demographic dividendEast Asia & PacificEast Asia & Pacific (excluding high income)East Asia & Pacific (IDA & IBRD countries)EcuadorEgypt, Arab Rep.El SalvadorEritreaEstoniaEthiopiaEuro areaEurope & Central AsiaEurope & Central Asia (excluding high income)Europe & Central Asia (IDA & IBRD countries)European UnionFinlandFragile and conflict affected situationsFranceGabonGeorgiaGermanyGhanaGibraltarGreeceGuatemalaHaitiHeavily indebted poor countries (HIPC)High incomeHondurasHong Kong SAR, ChinaHungaryIBRD onlyIcelandIDA & IBRD totalIDA blendIDA onlyIDA totalIndiaIndonesiaIran, Islamic Rep.IraqIrelandIsraelItalyJamaicaJapanJordanKazakhstanKenyaKorea, Dem. People’s Rep.Korea, Rep.KosovoKuwaitKyrgyz RepublicLate-demographic dividendLatin America & Caribbean Latin America & Caribbean (excluding high income)Latin America & the Caribbean (IDA & IBRD countries)LatviaLeast developed countries: UN classificationLebanonLibyaLithuaniaLow & middle incomeLower middle incomeLuxembourgMacedonia, FYRMalaysiaMaltaMauritiusMexicoMiddle East & North AfricaMiddle East & North Africa (excluding high income)Middle East & North Africa (IDA & IBRD countries)Middle incomeMoldovaMongoliaMontenegroMoroccoMozambiqueMyanmarNamibiaNepalNetherlandsNew ZealandNicaraguaNigerNigeriaNorth AmericaNorwayOECD membersOmanOther small statesPakistanPanamaParaguayPeruPhilippinesPolandPortugalPost-demographic dividendPre-demographic dividendQatarRomaniaRussian FederationSaudi ArabiaSenegalSerbiaSingaporeSlovak RepublicSloveniaSmall statesSouth AfricaSouth AsiaSouth Asia (IDA & IBRD)South SudanSpainSri LankaSub-Saharan Africa Sub-Saharan Africa (excluding high income)Sub-Saharan Africa (IDA & IBRD countries)SudanSwedenSwitzerlandSyrian Arab RepublicTajikistanTanzaniaThailandTogoTrinidad and TobagoTunisiaTurkeyTurkmenistanUkraineUnited Arab EmiratesUnited KingdomUnited StatesUpper middle incomeUruguayUzbekistanVenezuela, RBVietnamWorldYemen, Rep.ZambiaZimbabwe Timeline:
This timeline shows a graph from 1961 to 2015 of Austria. No data until 1960. Number of actual observations by date: 55.
Source name:
World Development Indicators
Source organization:
IEA Statistics © OECD/IEA 2014 (http://www.iea.org/stats/index.asp), subject to https://www.iea.org/t&c/termsandconditions/
Categories, topics:
Energy & Mining, Climate Change, Infrastructure
Last updated:
apr 23, 2017
Indicators value changes by year
Maximum:
17.702
jan 1, 1964
At the date of observation
Value
Absolute change
Change from previous value
jan 1, 1961
13.865
+13.865
0.0%
jan 1, 1962
17.376
+3.511
25.32%
jan 1, 1963
16.665
-0.711
-4.09%
jan 1, 1964
17.702
+1.037
6.22%
jan 1, 1965
16.843
-0.86
-4.86%
jan 1, 1966
12.045
-4.798
-28.49%
jan 1, 1967
12.467
+0.422
3.5%
jan 1, 1968
12.55
+0.083
0.67%
jan 1, 1969
13.018
+0.468
3.73%
jan 1, 1970
15.586
+2.568
19.73%
jan 1, 1971
9.724
-5.863
-37.61%
jan 1, 1972
13.12
+3.396
34.92%
jan 1, 1973
11.537
-1.583
-12.07%
jan 1, 1974
10.315
-1.222
-10.59%
jan 1, 1975
10.043
-0.272
-2.63%
jan 1, 1976
8.01
-2.034
-20.25%
jan 1, 1977
10.447
+2.437
30.43%
jan 1, 1978
6.657
-3.789
-36.27%
jan 1, 1979
6.649
-0.009
-0.13%
jan 1, 1980
5.913
-0.735
-11.06%
jan 1, 1981
7.022
+1.108
18.74%
jan 1, 1982
10.323
+3.301
47.02%
jan 1, 1983
9.016
-1.307
-12.66%
jan 1, 1984
10.071
+1.055
11.7%
jan 1, 1985
11.305
+1.234
12.25%
jan 1, 1986
10.928
-0.377
-3.34%
jan 1, 1987
9.344
-1.584
-14.5%
jan 1, 1988
9.922
+0.578
6.19%
jan 1, 1989
8.272
-1.65
-16.63%
jan 1, 1990
9.765
+1.493
18.05%
jan 1, 1991
14.212
+4.447
45.54%
jan 1, 1992
15.516
+1.304
9.17%
jan 1, 1993
10.194
-5.321
-34.3%
jan 1, 1994
7.28
-2.914
-28.58%
jan 1, 1995
7.499
+0.219
3.01%
jan 1, 1996
9.375
+1.876
25.01%
jan 1, 1997
11.601
+2.226
23.74%
jan 1, 1998
12.314
+0.713
6.15%
jan 1, 1999
9.179
-3.135
-25.46%
jan 1, 2000
9.104
-0.075
-0.81%
jan 1, 2001
11.255
+2.151
23.62%
jan 1, 2002
13.154
+1.899
16.87%
jan 1, 2003
12.877
-0.278
-2.11%
jan 1, 2004
16.373
+3.496
27.15%
jan 1, 2005
14.705
-1.668
-10.19%
jan 1, 2006
13.246
-1.459
-9.92%
jan 1, 2007
13.546
+0.3
2.27%
jan 1, 2008
12.213
-1.333
-9.84%
jan 1, 2009
10.764
-1.449
-11.87%
jan 1, 2010
7.591
-3.173
-29.48%
jan 1, 2011
9.867
+2.276
29.98%
jan 1, 2012
11.779
+1.912
19.37%
jan 1, 2013
9.087
-2.692
-22.85%
jan 1, 2014
9.447
+0.36
3.96%
jan 1, 2015
7.968
-1.479
-15.65%
Ranking of countries by current statistics by years


Comments: