29
/
en
AIzaSyAYiBZKx7MnpbEhh9jyipgxe19OcubqV5w
April 1, 2024
199014
Mongolia
MNG
true
2
1
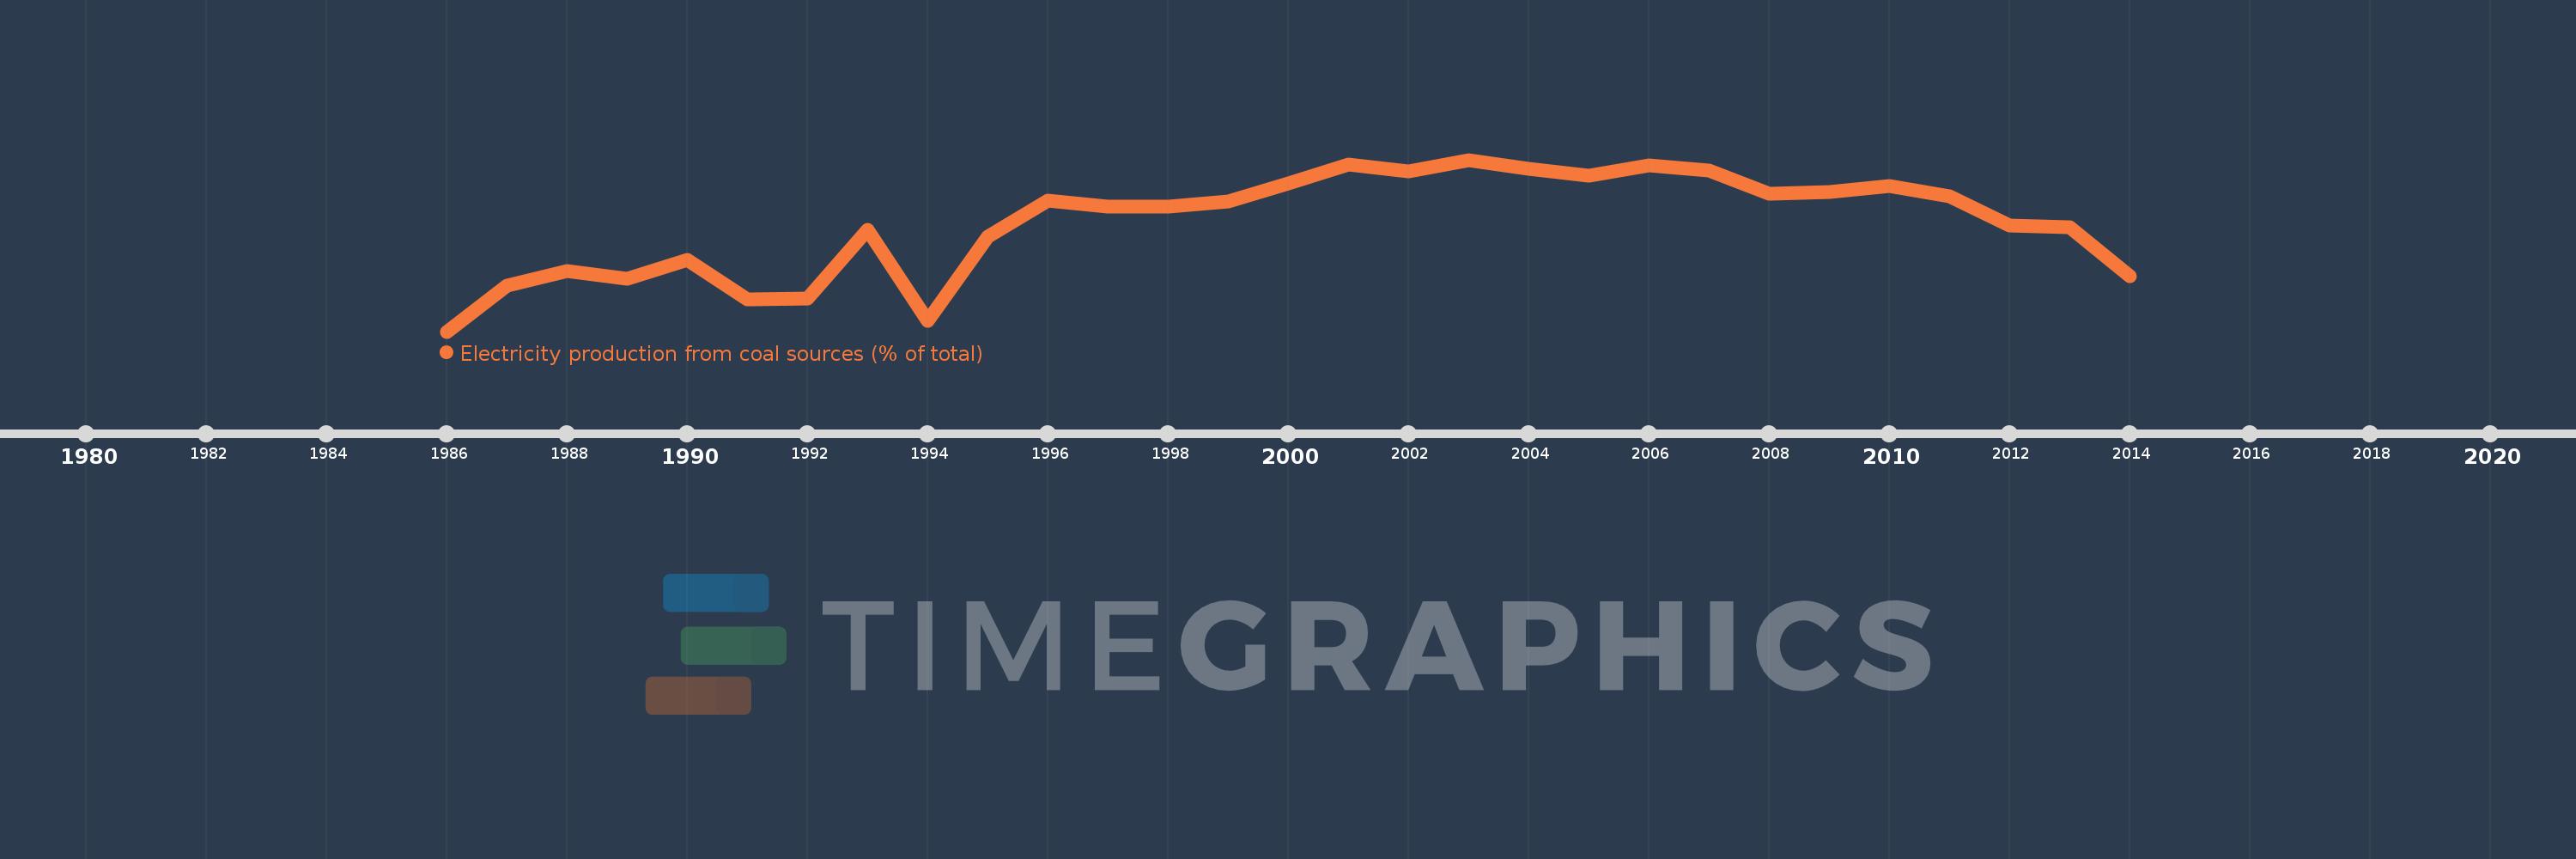
Electricity production from coal sources (% of total)
2014,2013,2012,2011,2010,2009,2008,2007,2006,2005,2004,2003,2002,2001,2000,1999,1998,1997,1996,1995,1994,1993,1992,1991,1990,1989,1988,1987,1986
This statistics in other country:
AlbaniaAlgeriaAngolaArab WorldArgentinaArmeniaAustraliaAustriaAzerbaijanBahrainBangladeshBelarusBelgiumBeninBoliviaBosnia and HerzegovinaBotswanaBrazilBrunei DarussalamBulgariaCambodiaCameroonCanadaCentral Europe and the BalticsChileChinaColombiaCongo, Dem. Rep.Congo, Rep.Costa RicaCote d'IvoireCroatiaCubaCuracaoCyprusCzech RepublicDenmarkDominican RepublicEarly-demographic dividendEast Asia & PacificEast Asia & Pacific (excluding high income)East Asia & Pacific (IDA & IBRD countries)EcuadorEgypt, Arab Rep.El SalvadorEritreaEstoniaEthiopiaEuro areaEurope & Central AsiaEurope & Central Asia (excluding high income)Europe & Central Asia (IDA & IBRD countries)European UnionFinlandFragile and conflict affected situationsFranceGabonGeorgiaGermanyGhanaGibraltarGreeceGuatemalaHaitiHeavily indebted poor countries (HIPC)High incomeHondurasHong Kong SAR, ChinaHungaryIBRD onlyIcelandIDA & IBRD totalIDA blendIDA onlyIDA totalIndiaIndonesiaIran, Islamic Rep.IraqIrelandIsraelItalyJamaicaJapanJordanKazakhstanKenyaKorea, Dem. People’s Rep.Korea, Rep.KosovoKuwaitKyrgyz RepublicLate-demographic dividendLatin America & Caribbean Latin America & Caribbean (excluding high income)Latin America & the Caribbean (IDA & IBRD countries)LatviaLeast developed countries: UN classificationLebanonLibyaLithuaniaLow & middle incomeLower middle incomeLuxembourgMacedonia, FYRMalaysiaMaltaMauritiusMexicoMiddle East & North AfricaMiddle East & North Africa (excluding high income)Middle East & North Africa (IDA & IBRD countries)Middle incomeMoldovaMongoliaMontenegroMoroccoMozambiqueMyanmarNamibiaNepalNetherlandsNew ZealandNicaraguaNigerNigeriaNorth AmericaNorwayOECD membersOmanOther small statesPakistanPanamaParaguayPeruPhilippinesPolandPortugalPost-demographic dividendPre-demographic dividendQatarRomaniaRussian FederationSaudi ArabiaSenegalSerbiaSingaporeSlovak RepublicSloveniaSmall statesSouth AfricaSouth AsiaSouth Asia (IDA & IBRD)South SudanSpainSri LankaSub-Saharan Africa Sub-Saharan Africa (excluding high income)Sub-Saharan Africa (IDA & IBRD countries)SudanSwedenSwitzerlandSyrian Arab RepublicTajikistanTanzaniaThailandTogoTrinidad and TobagoTunisiaTurkeyTurkmenistanUkraineUnited Arab EmiratesUnited KingdomUnited StatesUpper middle incomeUruguayUzbekistanVenezuela, RBVietnamWorldYemen, Rep.ZambiaZimbabwe Timeline:
This timeline shows a graph from 1986 to 2014 of Mongolia. No data until 1985. Number of actual observations by date: 29.
Source name:
World Development Indicators
Source organization:
IEA Statistics © OECD/IEA 2014 (http://www.iea.org/stats/index.asp), subject to https://www.iea.org/t&c/termsandconditions/
Categories, topics:
Energy & Mining, Climate Change, Infrastructure
Last updated:
apr 23, 2017
Indicators value changes by year
Maximum:
97.172
jan 1, 2003
At the date of observation
Value
Absolute change
Change from previous value
jan 1, 1986
90.96
+90.96
0.0%
jan 1, 1987
92.618
+1.658
1.82%
jan 1, 1988
93.162
+0.544
0.59%
jan 1, 1989
92.861
-0.301
-0.32%
jan 1, 1990
93.564
+0.703
0.76%
jan 1, 1991
92.115
-1.449
-1.55%
jan 1, 1992
92.165
+0.05
0.05%
jan 1, 1993
94.64
+2.475
2.69%
jan 1, 1994
91.363
-3.277
-3.46%
jan 1, 1995
94.401
+3.038
3.33%
jan 1, 1996
95.7
+1.299
1.38%
jan 1, 1997
95.486
-0.214
-0.22%
jan 1, 1998
95.492
+0.006
0.01%
jan 1, 1999
95.664
+0.171
0.18%
jan 1, 2000
96.305
+0.642
0.67%
jan 1, 2001
97.013
+0.707
0.73%
jan 1, 2002
96.752
-0.261
-0.27%
jan 1, 2003
97.172
+0.42
0.43%
jan 1, 2004
96.845
-0.327
-0.34%
jan 1, 2005
96.609
-0.236
-0.24%
jan 1, 2006
96.958
+0.349
0.36%
jan 1, 2007
96.783
-0.175
-0.18%
jan 1, 2008
95.947
-0.836
-0.86%
jan 1, 2009
96.001
+0.054
0.06%
jan 1, 2010
96.237
+0.236
0.25%
jan 1, 2011
95.85
-0.387
-0.4%
jan 1, 2012
94.797
-1.053
-1.1%
jan 1, 2013
94.747
-0.051
-0.05%
jan 1, 2014
92.948
-1.798
-1.9%
Ranking of countries by current statistics by years


Comments: