29
/
en
AIzaSyAYiBZKx7MnpbEhh9jyipgxe19OcubqV5w
April 1, 2024
54691
Post-demographic dividend
PST
false
2
1
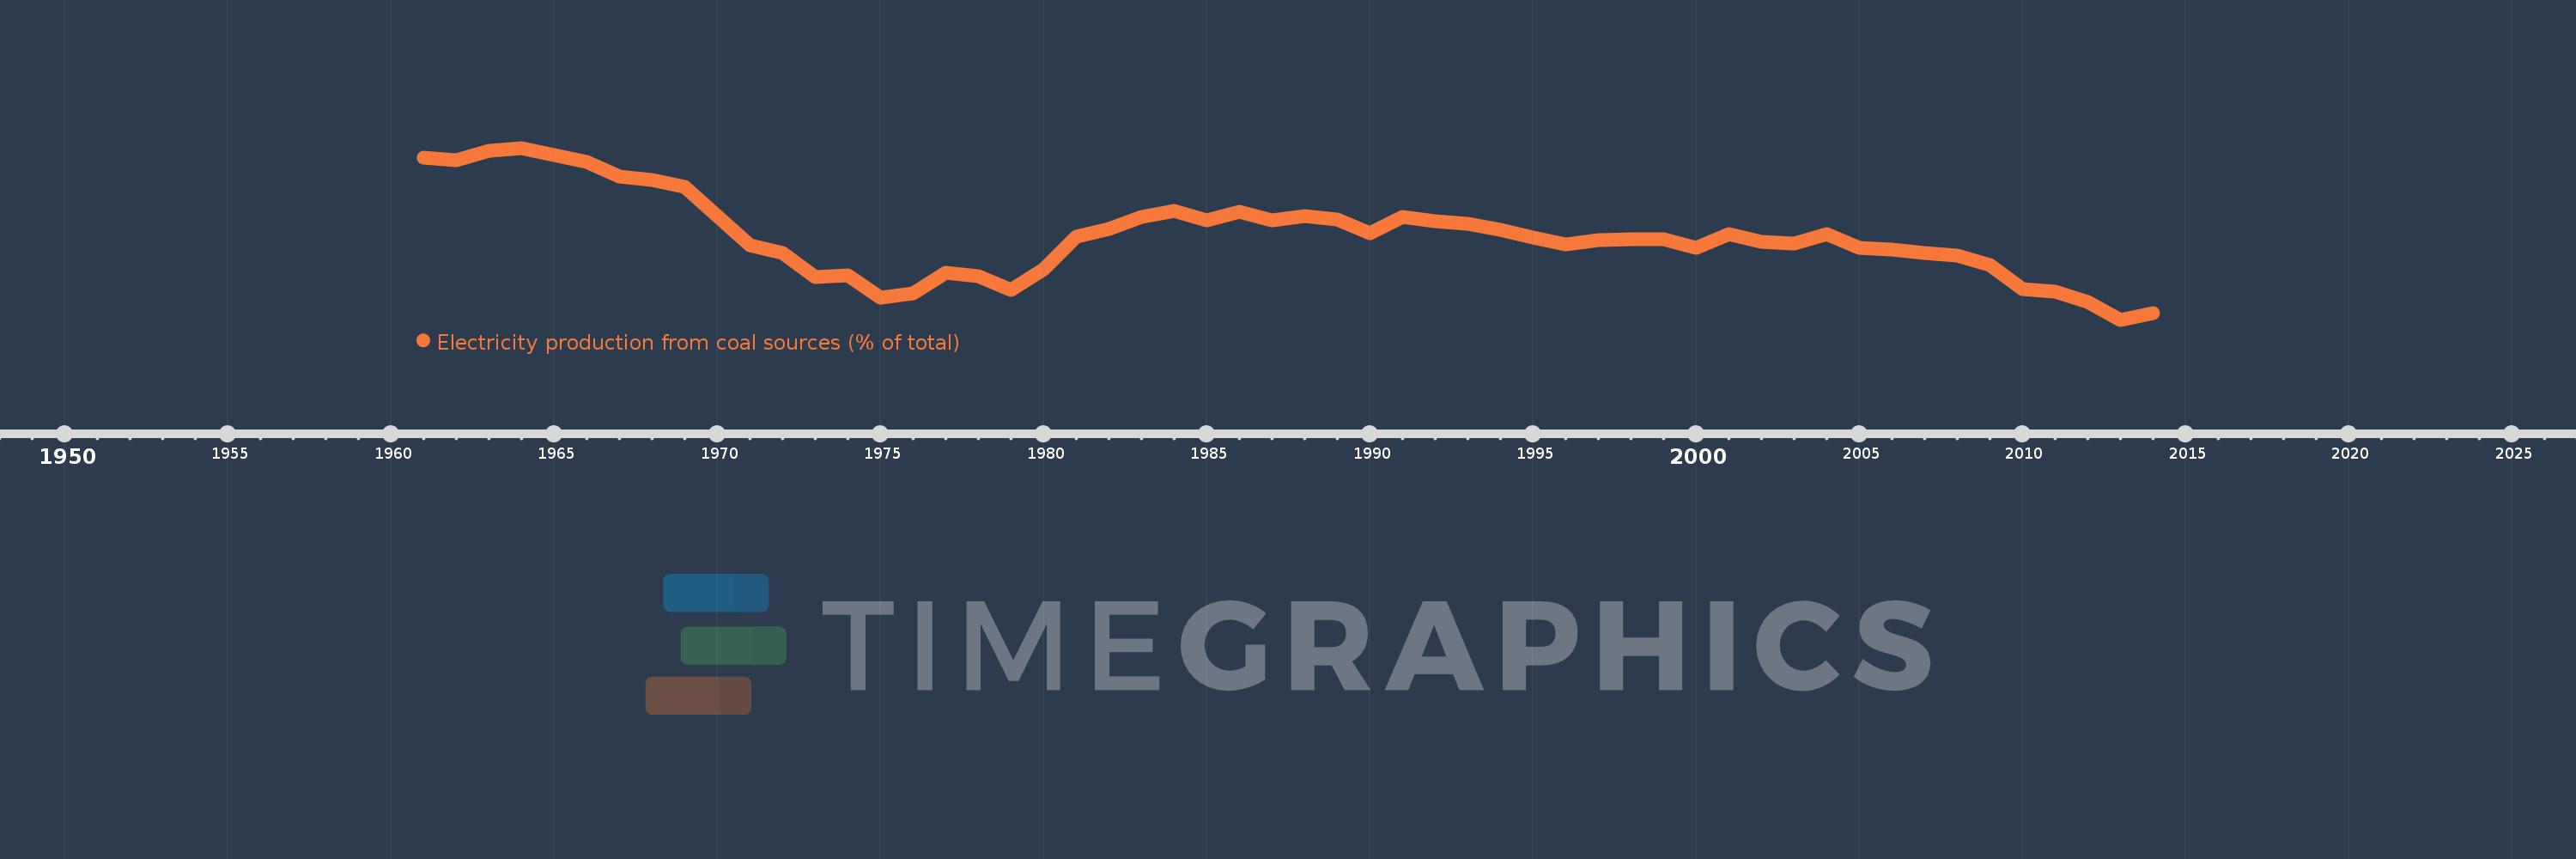
Electricity production from coal sources (% of total)
2014,2013,2012,2011,2010,2009,2008,2007,2006,2005,2004,2003,2002,2001,2000,1999,1998,1997,1996,1995,1994,1993,1992,1991,1990,1989,1988,1987,1986,1985,1984,1983,1982,1981,1980,1979,1978,1977,1976,1975,1974,1973,1972,1971,1970,1969,1968,1967,1966,1965,1964,1963,1962,1961
This statistics in other country:
AlbaniaAlgeriaAngolaArab WorldArgentinaArmeniaAustraliaAustriaAzerbaijanBahrainBangladeshBelarusBelgiumBeninBoliviaBosnia and HerzegovinaBotswanaBrazilBrunei DarussalamBulgariaCambodiaCameroonCanadaCentral Europe and the BalticsChileChinaColombiaCongo, Dem. Rep.Congo, Rep.Costa RicaCote d'IvoireCroatiaCubaCuracaoCyprusCzech RepublicDenmarkDominican RepublicEarly-demographic dividendEast Asia & PacificEast Asia & Pacific (excluding high income)East Asia & Pacific (IDA & IBRD countries)EcuadorEgypt, Arab Rep.El SalvadorEritreaEstoniaEthiopiaEuro areaEurope & Central AsiaEurope & Central Asia (excluding high income)Europe & Central Asia (IDA & IBRD countries)European UnionFinlandFragile and conflict affected situationsFranceGabonGeorgiaGermanyGhanaGibraltarGreeceGuatemalaHaitiHeavily indebted poor countries (HIPC)High incomeHondurasHong Kong SAR, ChinaHungaryIBRD onlyIcelandIDA & IBRD totalIDA blendIDA onlyIDA totalIndiaIndonesiaIran, Islamic Rep.IraqIrelandIsraelItalyJamaicaJapanJordanKazakhstanKenyaKorea, Dem. People’s Rep.Korea, Rep.KosovoKuwaitKyrgyz RepublicLate-demographic dividendLatin America & Caribbean Latin America & Caribbean (excluding high income)Latin America & the Caribbean (IDA & IBRD countries)LatviaLeast developed countries: UN classificationLebanonLibyaLithuaniaLow & middle incomeLower middle incomeLuxembourgMacedonia, FYRMalaysiaMaltaMauritiusMexicoMiddle East & North AfricaMiddle East & North Africa (excluding high income)Middle East & North Africa (IDA & IBRD countries)Middle incomeMoldovaMongoliaMontenegroMoroccoMozambiqueMyanmarNamibiaNepalNetherlandsNew ZealandNicaraguaNigerNigeriaNorth AmericaNorwayOECD membersOmanOther small statesPakistanPanamaParaguayPeruPhilippinesPolandPortugalPost-demographic dividendPre-demographic dividendQatarRomaniaRussian FederationSaudi ArabiaSenegalSerbiaSingaporeSlovak RepublicSloveniaSmall statesSouth AfricaSouth AsiaSouth Asia (IDA & IBRD)South SudanSpainSri LankaSub-Saharan Africa Sub-Saharan Africa (excluding high income)Sub-Saharan Africa (IDA & IBRD countries)SudanSwedenSwitzerlandSyrian Arab RepublicTajikistanTanzaniaThailandTogoTrinidad and TobagoTunisiaTurkeyTurkmenistanUkraineUnited Arab EmiratesUnited KingdomUnited StatesUpper middle incomeUruguayUzbekistanVenezuela, RBVietnamWorldYemen, Rep.ZambiaZimbabwe Timeline:
This timeline shows a graph from 1961 to 2014 of Post-demographic dividend. No data until 1960. Number of actual observations by date: 54.
Source name:
World Development Indicators
Source organization:
IEA Statistics © OECD/IEA 2014 (http://www.iea.org/stats/index.asp), subject to https://www.iea.org/t&c/termsandconditions/
Categories, topics:
Energy & Mining, Climate Change, Infrastructure
Last updated:
apr 23, 2017
Indicators value changes by year
Minimum:
31.992
jan 1, 2013
Maximum:
44.689
jan 1, 1964
At the date of observation
Value
Absolute change
Change from previous value
jan 1, 1961
43.99
+43.99
0.0%
jan 1, 1962
43.811
-0.179
-0.41%
jan 1, 1963
44.494
+0.683
1.56%
jan 1, 1964
44.689
+0.195
0.44%
jan 1, 1965
44.188
-0.501
-1.12%
jan 1, 1966
43.669
-0.519
-1.17%
jan 1, 1967
42.605
-1.064
-2.44%
jan 1, 1968
42.336
-0.269
-0.63%
jan 1, 1969
41.843
-0.493
-1.17%
jan 1, 1970
39.644
-2.199
-5.26%
jan 1, 1971
37.496
-2.147
-5.42%
jan 1, 1972
36.934
-0.562
-1.5%
jan 1, 1973
35.175
-1.759
-4.76%
jan 1, 1974
35.302
+0.127
0.36%
jan 1, 1975
33.65
-1.652
-4.68%
jan 1, 1976
33.913
+0.263
0.78%
jan 1, 1977
35.457
+1.544
4.55%
jan 1, 1978
35.236
-0.221
-0.62%
jan 1, 1979
34.185
-1.052
-2.98%
jan 1, 1980
35.704
+1.519
4.44%
jan 1, 1981
38.136
+2.432
6.81%
jan 1, 1982
38.672
+0.536
1.41%
jan 1, 1983
39.576
+0.904
2.34%
jan 1, 1984
40.022
+0.446
1.13%
jan 1, 1985
39.309
-0.713
-1.78%
jan 1, 1986
39.949
+0.64
1.63%
jan 1, 1987
39.368
-0.581
-1.45%
jan 1, 1988
39.644
+0.276
0.7%
jan 1, 1989
39.416
-0.228
-0.57%
jan 1, 1990
38.358
-1.058
-2.68%
jan 1, 1991
39.616
+1.257
3.28%
jan 1, 1992
39.273
-0.343
-0.87%
jan 1, 1993
39.074
-0.198
-0.51%
jan 1, 1994
38.66
-0.415
-1.06%
jan 1, 1995
38.095
-0.565
-1.46%
jan 1, 1996
37.576
-0.519
-1.36%
jan 1, 1997
37.897
+0.321
0.85%
jan 1, 1998
37.932
+0.035
0.09%
jan 1, 1999
37.932
+0.0
0.0%
jan 1, 2000
37.331
-0.601
-1.58%
jan 1, 2001
38.303
+0.972
2.6%
jan 1, 2002
37.731
-0.572
-1.49%
jan 1, 2003
37.631
-0.1
-0.26%
jan 1, 2004
38.344
+0.713
1.9%
jan 1, 2005
37.296
-1.048
-2.73%
jan 1, 2006
37.153
-0.143
-0.38%
jan 1, 2007
36.912
-0.241
-0.65%
jan 1, 2008
36.713
-0.199
-0.54%
jan 1, 2009
36.048
-0.665
-1.81%
jan 1, 2010
34.228
-1.82
-5.05%
jan 1, 2011
34.078
-0.15
-0.44%
jan 1, 2012
33.279
-0.798
-2.34%
jan 1, 2013
31.992
-1.287
-3.87%
jan 1, 2014
32.478
+0.486
1.52%
Ranking of countries by current statistics by years


Comments: