29
/
en
AIzaSyAYiBZKx7MnpbEhh9jyipgxe19OcubqV5w
April 1, 2024
28033
East Asia & Pacific (excluding high income)
EAP
false
2
1
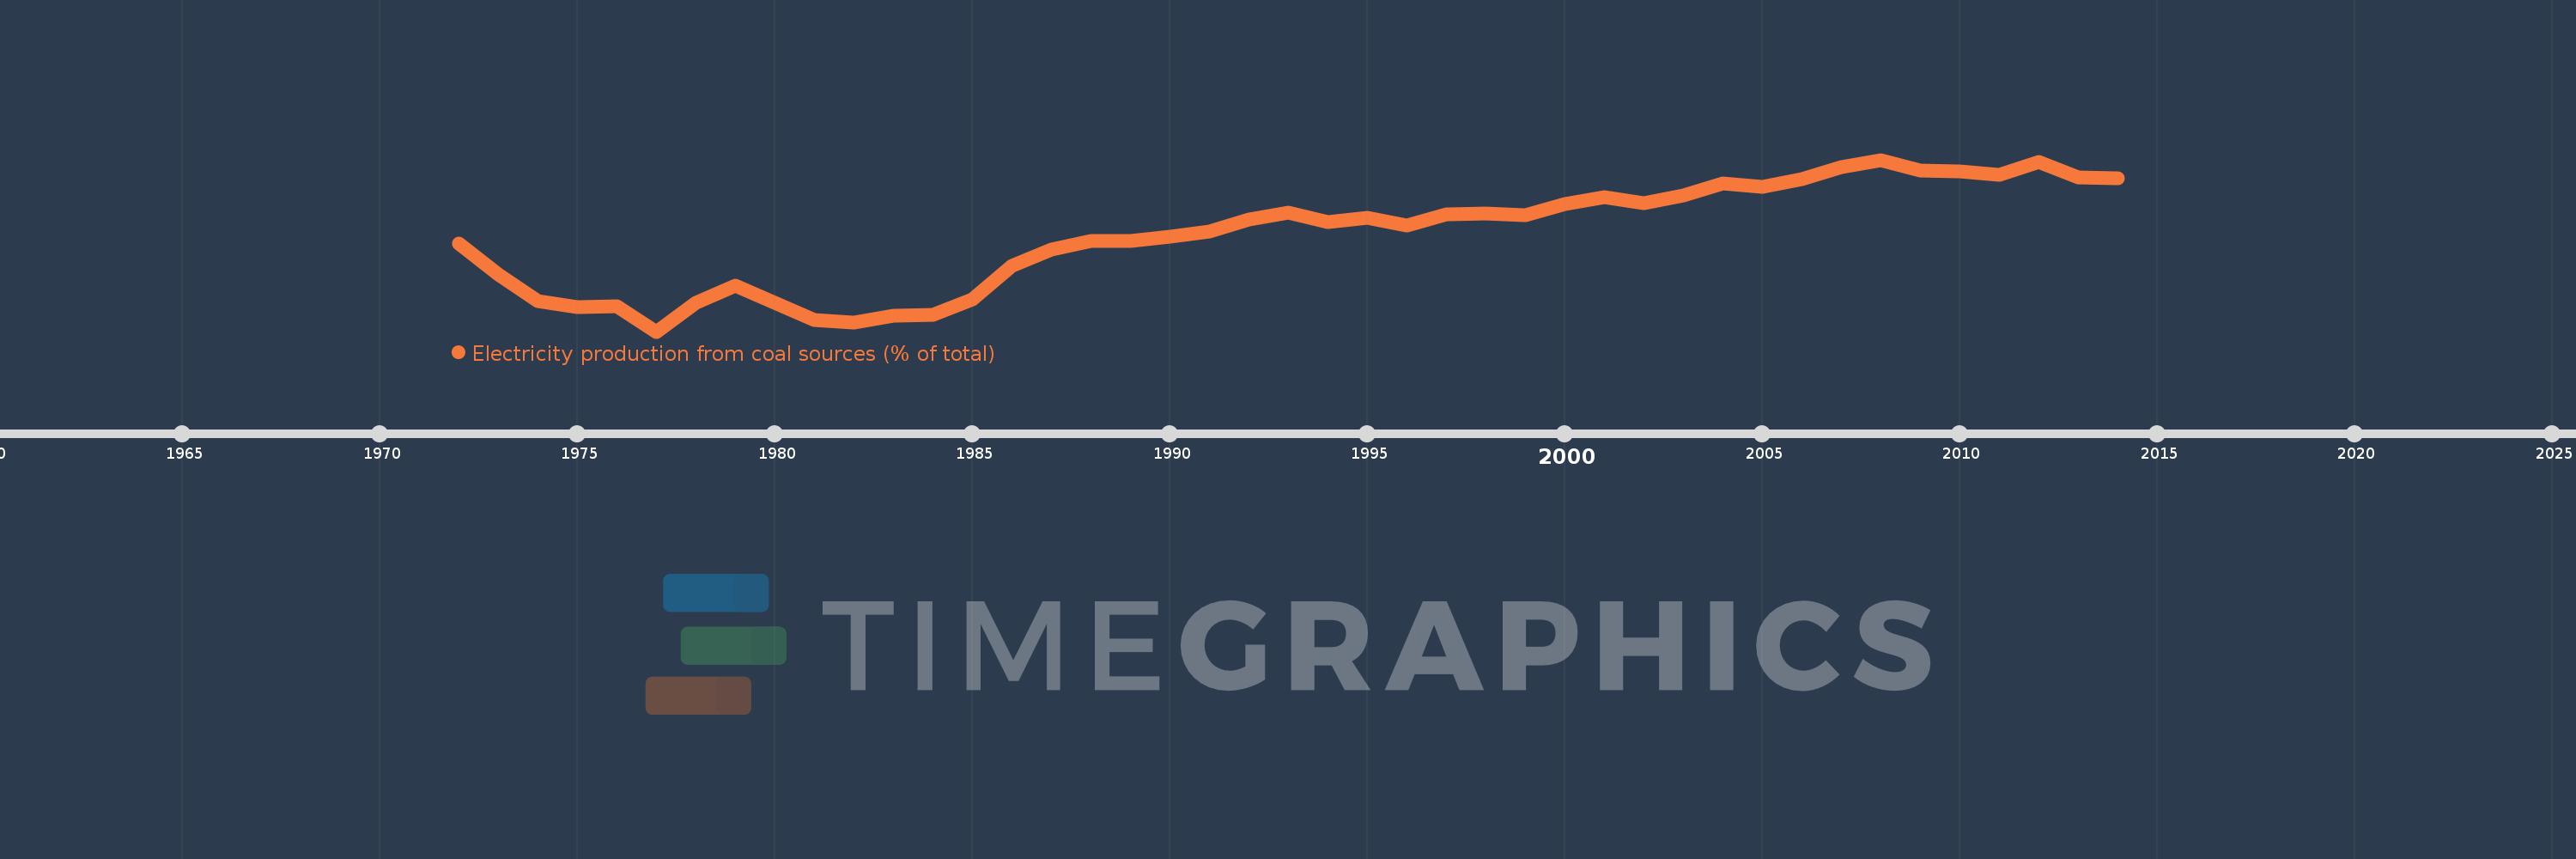
Electricity production from coal sources (% of total)
2014,2013,2012,2011,2010,2009,2008,2007,2006,2005,2004,2003,2002,2001,2000,1999,1998,1997,1996,1995,1994,1993,1992,1991,1990,1989,1988,1987,1986,1985,1984,1983,1982,1981,1980,1979,1978,1977,1976,1975,1974,1973,1972
This statistics in other country:
AlbaniaAlgeriaAngolaArab WorldArgentinaArmeniaAustraliaAustriaAzerbaijanBahrainBangladeshBelarusBelgiumBeninBoliviaBosnia and HerzegovinaBotswanaBrazilBrunei DarussalamBulgariaCambodiaCameroonCanadaCentral Europe and the BalticsChileChinaColombiaCongo, Dem. Rep.Congo, Rep.Costa RicaCote d'IvoireCroatiaCubaCuracaoCyprusCzech RepublicDenmarkDominican RepublicEarly-demographic dividendEast Asia & PacificEast Asia & Pacific (excluding high income)East Asia & Pacific (IDA & IBRD countries)EcuadorEgypt, Arab Rep.El SalvadorEritreaEstoniaEthiopiaEuro areaEurope & Central AsiaEurope & Central Asia (excluding high income)Europe & Central Asia (IDA & IBRD countries)European UnionFinlandFragile and conflict affected situationsFranceGabonGeorgiaGermanyGhanaGibraltarGreeceGuatemalaHaitiHeavily indebted poor countries (HIPC)High incomeHondurasHong Kong SAR, ChinaHungaryIBRD onlyIcelandIDA & IBRD totalIDA blendIDA onlyIDA totalIndiaIndonesiaIran, Islamic Rep.IraqIrelandIsraelItalyJamaicaJapanJordanKazakhstanKenyaKorea, Dem. People’s Rep.Korea, Rep.KosovoKuwaitKyrgyz RepublicLate-demographic dividendLatin America & Caribbean Latin America & Caribbean (excluding high income)Latin America & the Caribbean (IDA & IBRD countries)LatviaLeast developed countries: UN classificationLebanonLibyaLithuaniaLow & middle incomeLower middle incomeLuxembourgMacedonia, FYRMalaysiaMaltaMauritiusMexicoMiddle East & North AfricaMiddle East & North Africa (excluding high income)Middle East & North Africa (IDA & IBRD countries)Middle incomeMoldovaMongoliaMontenegroMoroccoMozambiqueMyanmarNamibiaNepalNetherlandsNew ZealandNicaraguaNigerNigeriaNorth AmericaNorwayOECD membersOmanOther small statesPakistanPanamaParaguayPeruPhilippinesPolandPortugalPost-demographic dividendPre-demographic dividendQatarRomaniaRussian FederationSaudi ArabiaSenegalSerbiaSingaporeSlovak RepublicSloveniaSmall statesSouth AfricaSouth AsiaSouth Asia (IDA & IBRD)South SudanSpainSri LankaSub-Saharan Africa Sub-Saharan Africa (excluding high income)Sub-Saharan Africa (IDA & IBRD countries)SudanSwedenSwitzerlandSyrian Arab RepublicTajikistanTanzaniaThailandTogoTrinidad and TobagoTunisiaTurkeyTurkmenistanUkraineUnited Arab EmiratesUnited KingdomUnited StatesUpper middle incomeUruguayUzbekistanVenezuela, RBVietnamWorldYemen, Rep.ZambiaZimbabwe Timeline:
This timeline shows a graph from 1972 to 2014 of East Asia & Pacific (excluding high income). No data until 1971. Number of actual observations by date: 43.
Source name:
World Development Indicators
Source organization:
IEA Statistics © OECD/IEA 2014 (http://www.iea.org/stats/index.asp), subject to https://www.iea.org/t&c/termsandconditions/
Categories, topics:
Energy & Mining, Climate Change, Infrastructure
Last updated:
apr 23, 2017
Indicators value changes by year
Maximum:
73.482
jan 1, 2008
At the date of observation
Value
Absolute change
Change from previous value
jan 1, 1972
58.839
+58.839
0.0%
jan 1, 1973
53.492
-5.346
-9.09%
jan 1, 1974
48.722
-4.77
-8.92%
jan 1, 1975
47.748
-0.974
-2.0%
jan 1, 1976
47.809
+0.062
0.13%
jan 1, 1977
43.43
-4.379
-9.16%
jan 1, 1978
48.401
+4.971
11.45%
jan 1, 1979
51.539
+3.138
6.48%
jan 1, 1980
48.513
-3.025
-5.87%
jan 1, 1981
45.407
-3.107
-6.4%
jan 1, 1982
44.978
-0.428
-0.94%
jan 1, 1983
46.14
+1.162
2.58%
jan 1, 1984
46.337
+0.197
0.43%
jan 1, 1985
49.088
+2.751
5.94%
jan 1, 1986
54.858
+5.77
11.75%
jan 1, 1987
57.844
+2.986
5.44%
jan 1, 1988
59.253
+1.409
2.44%
jan 1, 1989
59.255
+0.002
0.0%
jan 1, 1990
59.964
+0.708
1.19%
jan 1, 1991
60.987
+1.024
1.71%
jan 1, 1992
63.034
+2.046
3.36%
jan 1, 1993
64.245
+1.211
1.92%
jan 1, 1994
62.56
-1.685
-2.62%
jan 1, 1995
63.356
+0.796
1.27%
jan 1, 1996
62.046
-1.31
-2.07%
jan 1, 1997
63.888
+1.842
2.97%
jan 1, 1998
64.139
+0.251
0.39%
jan 1, 1999
63.719
-0.42
-0.65%
jan 1, 2000
65.757
+2.038
3.2%
jan 1, 2001
66.937
+1.18
1.79%
jan 1, 2002
65.822
-1.115
-1.67%
jan 1, 2003
67.244
+1.422
2.16%
jan 1, 2004
69.382
+2.138
3.18%
jan 1, 2005
68.726
-0.656
-0.94%
jan 1, 2006
70.135
+1.409
2.05%
jan 1, 2007
72.147
+2.012
2.87%
jan 1, 2008
73.482
+1.335
1.85%
jan 1, 2009
71.597
-1.886
-2.57%
jan 1, 2010
71.486
-0.111
-0.16%
jan 1, 2011
70.866
-0.62
-0.87%
jan 1, 2012
73.15
+2.284
3.22%
jan 1, 2013
70.428
-2.722
-3.72%
jan 1, 2014
70.207
-0.221
-0.31%
Ranking of countries by current statistics by years


Comments: