29
/
en
AIzaSyAYiBZKx7MnpbEhh9jyipgxe19OcubqV5w
April 1, 2024
39836
IDA total
IDA
false
2
1
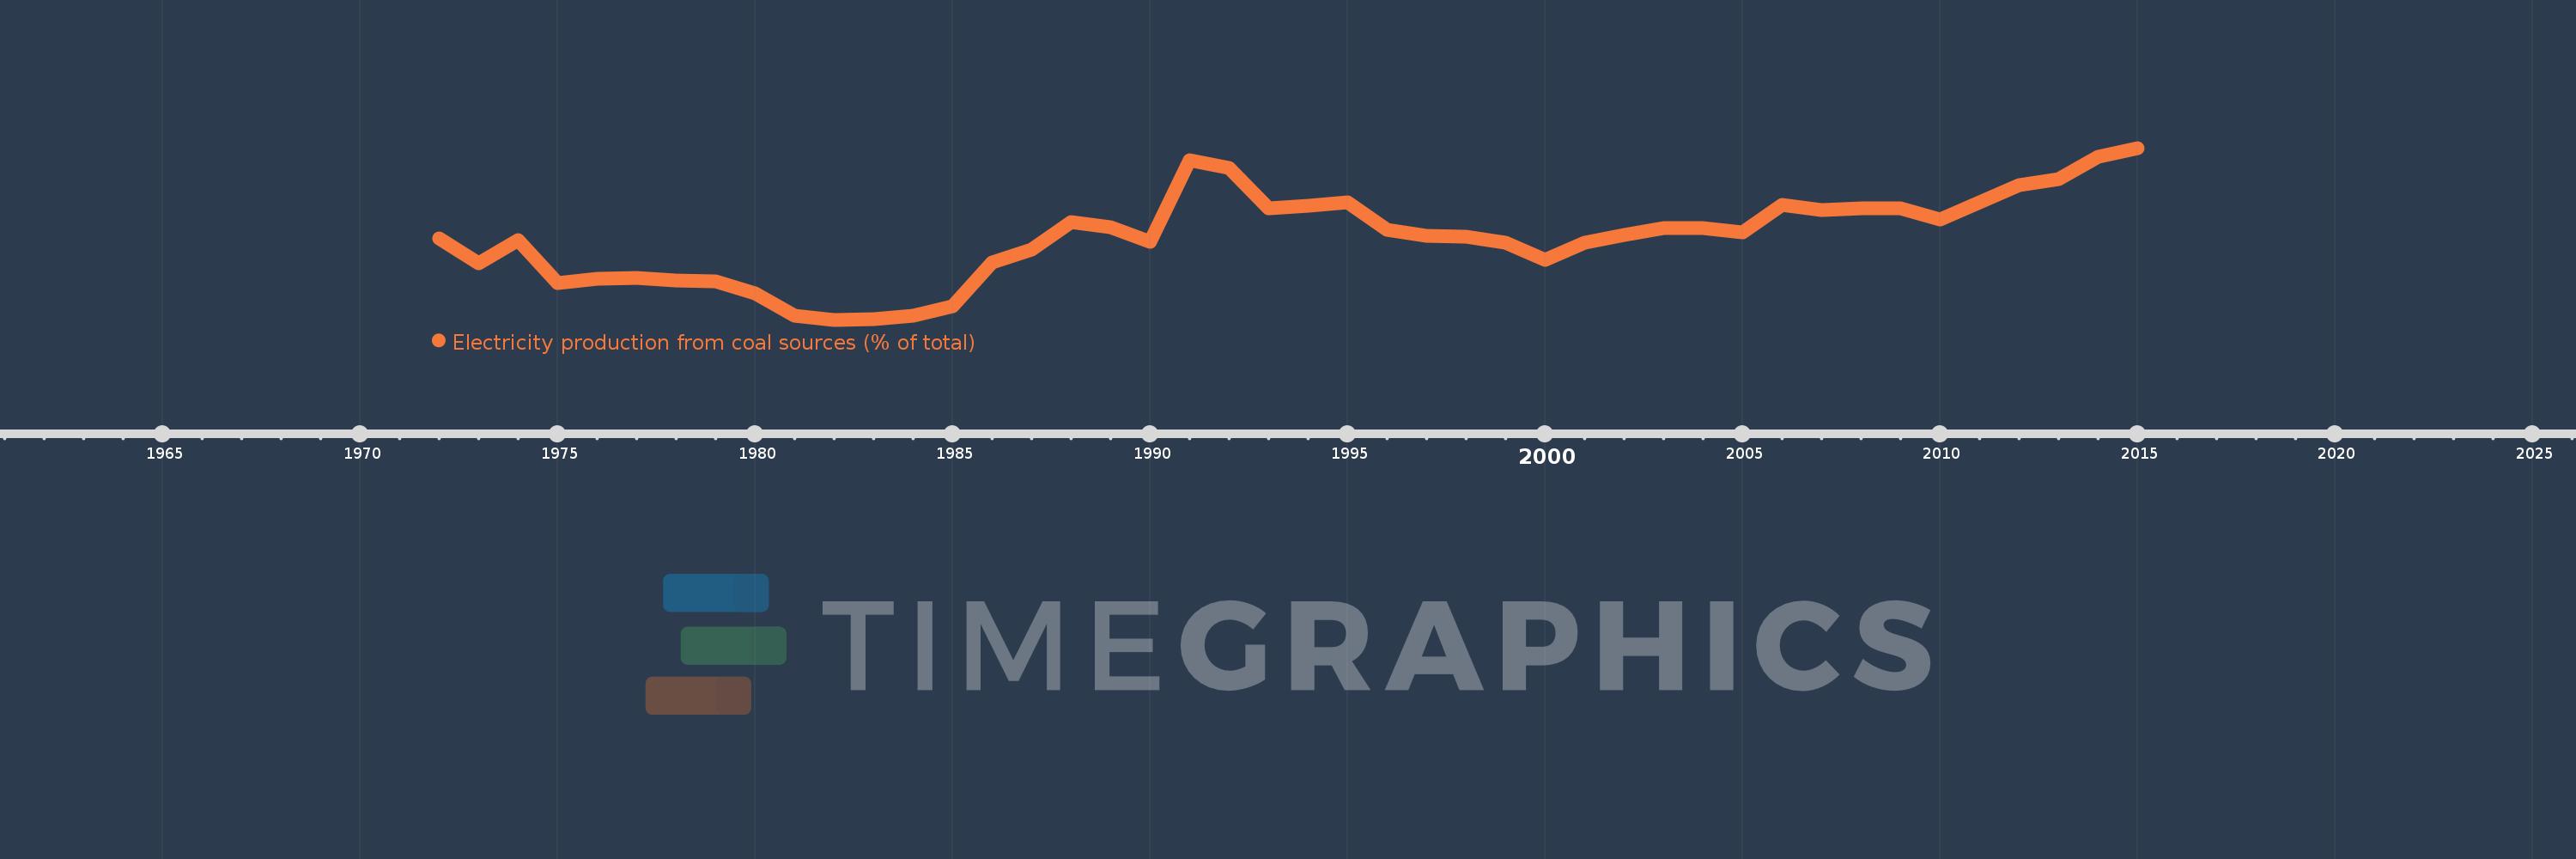
Electricity production from coal sources (% of total)
2015,2014,2013,2012,2011,2010,2009,2008,2007,2006,2005,2004,2003,2002,2001,2000,1999,1998,1997,1996,1995,1994,1993,1992,1991,1990,1989,1988,1987,1986,1985,1984,1983,1982,1981,1980,1979,1978,1977,1976,1975,1974,1973,1972
This statistics in other country:
AlbaniaAlgeriaAngolaArab WorldArgentinaArmeniaAustraliaAustriaAzerbaijanBahrainBangladeshBelarusBelgiumBeninBoliviaBosnia and HerzegovinaBotswanaBrazilBrunei DarussalamBulgariaCambodiaCameroonCanadaCentral Europe and the BalticsChileChinaColombiaCongo, Dem. Rep.Congo, Rep.Costa RicaCote d'IvoireCroatiaCubaCuracaoCyprusCzech RepublicDenmarkDominican RepublicEarly-demographic dividendEast Asia & PacificEast Asia & Pacific (excluding high income)East Asia & Pacific (IDA & IBRD countries)EcuadorEgypt, Arab Rep.El SalvadorEritreaEstoniaEthiopiaEuro areaEurope & Central AsiaEurope & Central Asia (excluding high income)Europe & Central Asia (IDA & IBRD countries)European UnionFinlandFragile and conflict affected situationsFranceGabonGeorgiaGermanyGhanaGibraltarGreeceGuatemalaHaitiHeavily indebted poor countries (HIPC)High incomeHondurasHong Kong SAR, ChinaHungaryIBRD onlyIcelandIDA & IBRD totalIDA blendIDA onlyIDA totalIndiaIndonesiaIran, Islamic Rep.IraqIrelandIsraelItalyJamaicaJapanJordanKazakhstanKenyaKorea, Dem. People’s Rep.Korea, Rep.KosovoKuwaitKyrgyz RepublicLate-demographic dividendLatin America & Caribbean Latin America & Caribbean (excluding high income)Latin America & the Caribbean (IDA & IBRD countries)LatviaLeast developed countries: UN classificationLebanonLibyaLithuaniaLow & middle incomeLower middle incomeLuxembourgMacedonia, FYRMalaysiaMaltaMauritiusMexicoMiddle East & North AfricaMiddle East & North Africa (excluding high income)Middle East & North Africa (IDA & IBRD countries)Middle incomeMoldovaMongoliaMontenegroMoroccoMozambiqueMyanmarNamibiaNepalNetherlandsNew ZealandNicaraguaNigerNigeriaNorth AmericaNorwayOECD membersOmanOther small statesPakistanPanamaParaguayPeruPhilippinesPolandPortugalPost-demographic dividendPre-demographic dividendQatarRomaniaRussian FederationSaudi ArabiaSenegalSerbiaSingaporeSlovak RepublicSloveniaSmall statesSouth AfricaSouth AsiaSouth Asia (IDA & IBRD)South SudanSpainSri LankaSub-Saharan Africa Sub-Saharan Africa (excluding high income)Sub-Saharan Africa (IDA & IBRD countries)SudanSwedenSwitzerlandSyrian Arab RepublicTajikistanTanzaniaThailandTogoTrinidad and TobagoTunisiaTurkeyTurkmenistanUkraineUnited Arab EmiratesUnited KingdomUnited StatesUpper middle incomeUruguayUzbekistanVenezuela, RBVietnamWorldYemen, Rep.ZambiaZimbabwe Timeline:
This timeline shows a graph from 1972 to 2015 of IDA total. No data until 1971. Number of actual observations by date: 44.
Source name:
World Development Indicators
Source organization:
IEA Statistics © OECD/IEA 2014 (http://www.iea.org/stats/index.asp), subject to https://www.iea.org/t&c/termsandconditions/
Categories, topics:
Energy & Mining, Climate Change, Infrastructure
Last updated:
apr 23, 2017
Indicators value changes by year
At the date of observation
Value
Absolute change
Change from previous value
jan 1, 1972
4.567
+4.567
0.0%
jan 1, 1973
3.566
-1.002
-21.93%
jan 1, 1974
4.489
+0.923
25.89%
jan 1, 1975
2.785
-1.704
-37.95%
jan 1, 1976
2.962
+0.177
6.36%
jan 1, 1977
2.998
+0.036
1.22%
jan 1, 1978
2.898
-0.1
-3.33%
jan 1, 1979
2.856
-0.042
-1.45%
jan 1, 1980
2.372
-0.484
-16.96%
jan 1, 1981
1.475
-0.897
-37.81%
jan 1, 1982
1.304
-0.171
-11.62%
jan 1, 1983
1.311
+0.007
0.56%
jan 1, 1984
1.462
+0.151
11.48%
jan 1, 1985
1.85
+0.388
26.53%
jan 1, 1986
3.618
+1.769
95.63%
jan 1, 1987
4.124
+0.506
13.97%
jan 1, 1988
5.229
+1.105
26.8%
jan 1, 1989
5.03
-0.199
-3.8%
jan 1, 1990
4.443
-0.587
-11.68%
jan 1, 1991
7.734
+3.291
74.06%
jan 1, 1992
7.408
-0.325
-4.21%
jan 1, 1993
5.777
-1.631
-22.01%
jan 1, 1994
5.891
+0.114
1.97%
jan 1, 1995
6.021
+0.13
2.2%
jan 1, 1996
4.922
-1.099
-18.25%
jan 1, 1997
4.686
-0.236
-4.8%
jan 1, 1998
4.648
-0.038
-0.8%
jan 1, 1999
4.409
-0.239
-5.15%
jan 1, 2000
3.722
-0.687
-15.58%
jan 1, 2001
4.401
+0.679
18.25%
jan 1, 2002
4.71
+0.308
7.0%
jan 1, 2003
4.979
+0.27
5.73%
jan 1, 2004
4.993
+0.013
0.27%
jan 1, 2005
4.803
-0.189
-3.79%
jan 1, 2006
5.924
+1.121
23.34%
jan 1, 2007
5.704
-0.22
-3.72%
jan 1, 2008
5.8
+0.096
1.68%
jan 1, 2009
5.782
-0.019
-0.32%
jan 1, 2010
5.336
-0.446
-7.71%
jan 1, 2011
6.009
+0.673
12.62%
jan 1, 2012
6.727
+0.717
11.94%
jan 1, 2013
6.974
+0.247
3.67%
jan 1, 2014
7.843
+0.869
12.46%
jan 1, 2015
8.211
+0.368
4.69%
Ranking of countries by current statistics by years


Comments: