29
/
en
AIzaSyAYiBZKx7MnpbEhh9jyipgxe19OcubqV5w
April 1, 2024
159298
Ireland
IRL
true
2
1
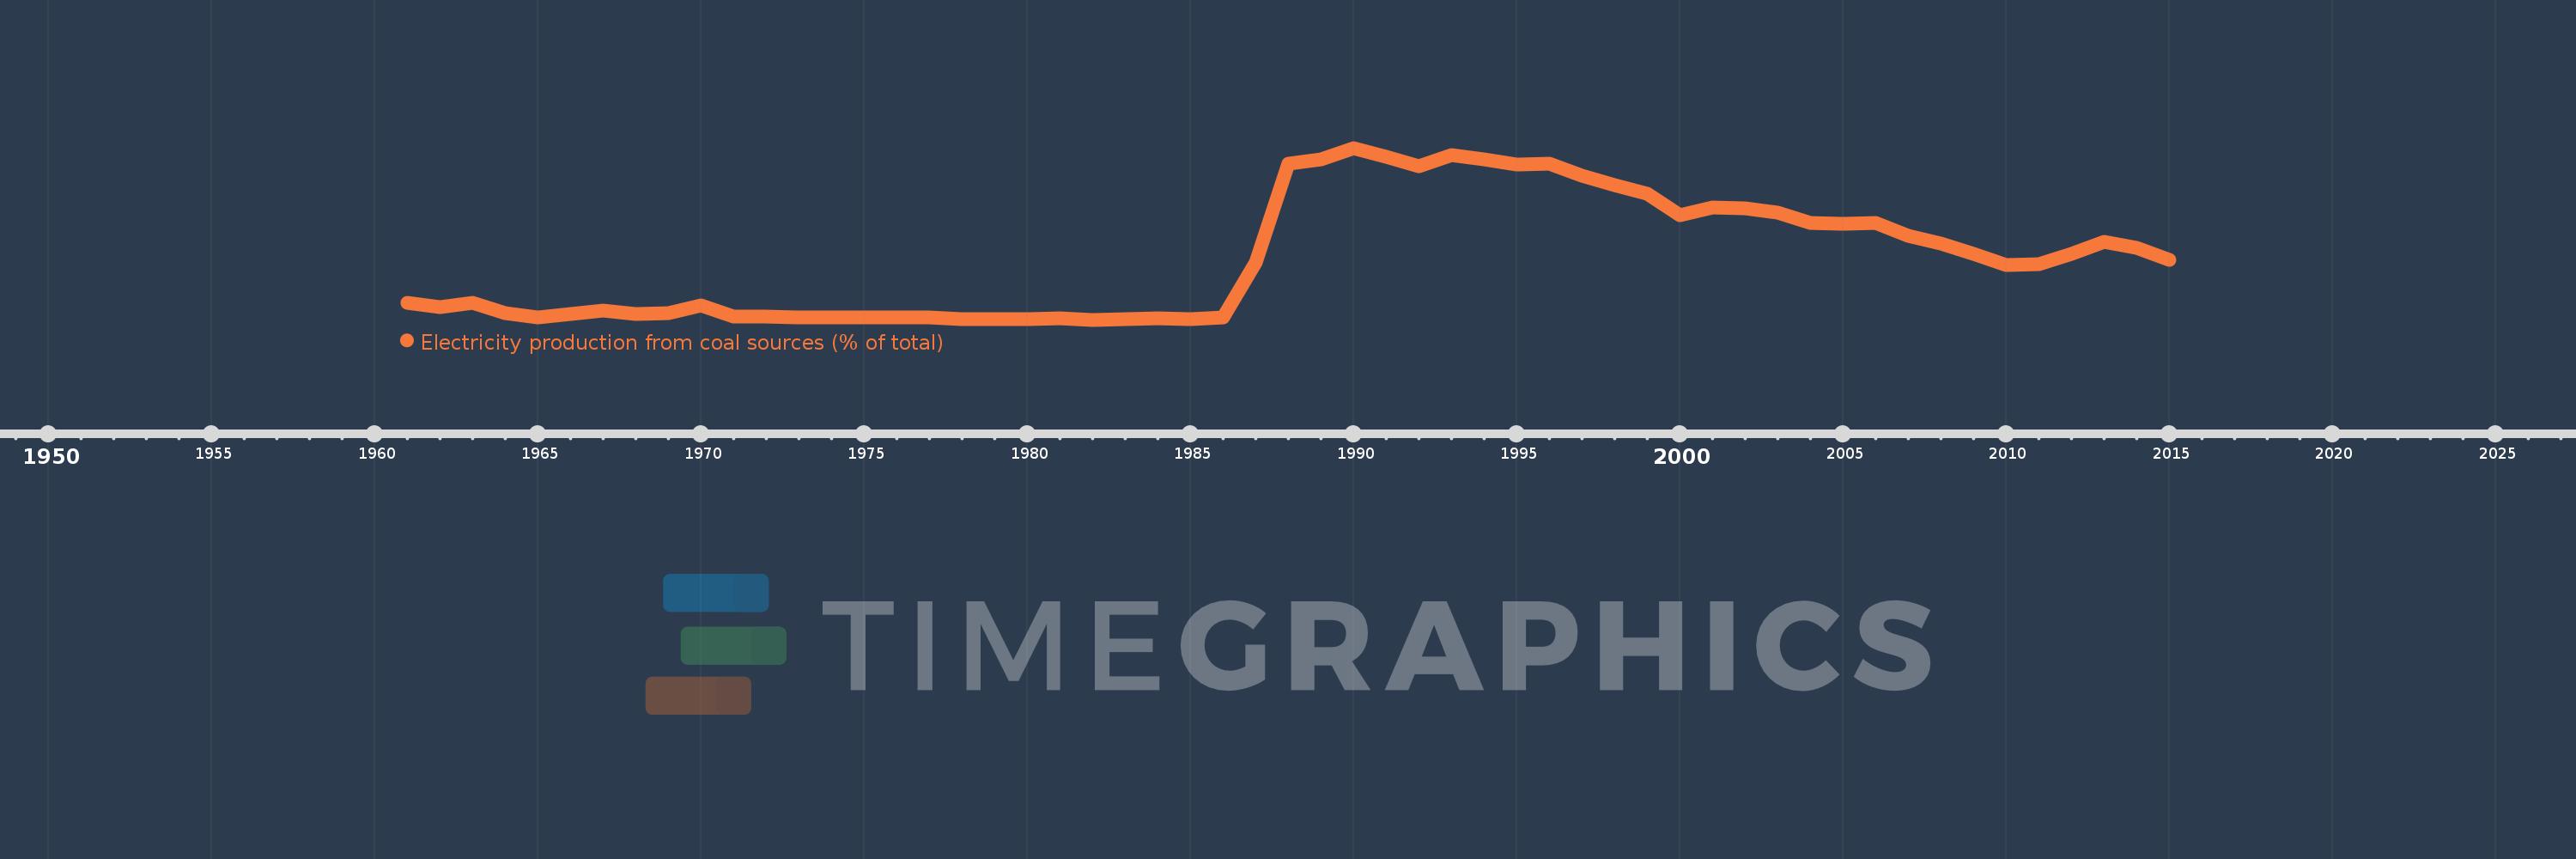
Electricity production from coal sources (% of total)
2015,2014,2013,2012,2011,2010,2009,2008,2007,2006,2005,2004,2003,2002,2001,2000,1999,1998,1997,1996,1995,1994,1993,1992,1991,1990,1989,1988,1987,1986,1985,1984,1983,1982,1981,1980,1979,1978,1977,1976,1975,1974,1973,1972,1971,1970,1969,1968,1967,1966,1965,1964,1963,1962,1961
This statistics in other country:
AlbaniaAlgeriaAngolaArab WorldArgentinaArmeniaAustraliaAustriaAzerbaijanBahrainBangladeshBelarusBelgiumBeninBoliviaBosnia and HerzegovinaBotswanaBrazilBrunei DarussalamBulgariaCambodiaCameroonCanadaCentral Europe and the BalticsChileChinaColombiaCongo, Dem. Rep.Congo, Rep.Costa RicaCote d'IvoireCroatiaCubaCuracaoCyprusCzech RepublicDenmarkDominican RepublicEarly-demographic dividendEast Asia & PacificEast Asia & Pacific (excluding high income)East Asia & Pacific (IDA & IBRD countries)EcuadorEgypt, Arab Rep.El SalvadorEritreaEstoniaEthiopiaEuro areaEurope & Central AsiaEurope & Central Asia (excluding high income)Europe & Central Asia (IDA & IBRD countries)European UnionFinlandFragile and conflict affected situationsFranceGabonGeorgiaGermanyGhanaGibraltarGreeceGuatemalaHaitiHeavily indebted poor countries (HIPC)High incomeHondurasHong Kong SAR, ChinaHungaryIBRD onlyIcelandIDA & IBRD totalIDA blendIDA onlyIDA totalIndiaIndonesiaIran, Islamic Rep.IraqIrelandIsraelItalyJamaicaJapanJordanKazakhstanKenyaKorea, Dem. People’s Rep.Korea, Rep.KosovoKuwaitKyrgyz RepublicLate-demographic dividendLatin America & Caribbean Latin America & Caribbean (excluding high income)Latin America & the Caribbean (IDA & IBRD countries)LatviaLeast developed countries: UN classificationLebanonLibyaLithuaniaLow & middle incomeLower middle incomeLuxembourgMacedonia, FYRMalaysiaMaltaMauritiusMexicoMiddle East & North AfricaMiddle East & North Africa (excluding high income)Middle East & North Africa (IDA & IBRD countries)Middle incomeMoldovaMongoliaMontenegroMoroccoMozambiqueMyanmarNamibiaNepalNetherlandsNew ZealandNicaraguaNigerNigeriaNorth AmericaNorwayOECD membersOmanOther small statesPakistanPanamaParaguayPeruPhilippinesPolandPortugalPost-demographic dividendPre-demographic dividendQatarRomaniaRussian FederationSaudi ArabiaSenegalSerbiaSingaporeSlovak RepublicSloveniaSmall statesSouth AfricaSouth AsiaSouth Asia (IDA & IBRD)South SudanSpainSri LankaSub-Saharan Africa Sub-Saharan Africa (excluding high income)Sub-Saharan Africa (IDA & IBRD countries)SudanSwedenSwitzerlandSyrian Arab RepublicTajikistanTanzaniaThailandTogoTrinidad and TobagoTunisiaTurkeyTurkmenistanUkraineUnited Arab EmiratesUnited KingdomUnited StatesUpper middle incomeUruguayUzbekistanVenezuela, RBVietnamWorldYemen, Rep.ZambiaZimbabwe Timeline:
This timeline shows a graph from 1961 to 2015 of Ireland. No data until 1960. Number of actual observations by date: 55.
Source name:
World Development Indicators
Source organization:
IEA Statistics © OECD/IEA 2014 (http://www.iea.org/stats/index.asp), subject to https://www.iea.org/t&c/termsandconditions/
Categories, topics:
Energy & Mining, Climate Change, Infrastructure
Last updated:
apr 23, 2017
Indicators value changes by year
Maximum:
43.919
jan 1, 1990
At the date of observation
Value
Absolute change
Change from previous value
jan 1, 1961
4.686
+4.686
0.0%
jan 1, 1962
3.628
-1.058
-22.58%
jan 1, 1963
4.641
+1.013
27.91%
jan 1, 1964
2.165
-2.476
-53.35%
jan 1, 1965
1.035
-1.13
-52.21%
jan 1, 1966
1.951
+0.916
88.55%
jan 1, 1967
2.722
+0.771
39.52%
jan 1, 1968
1.809
-0.913
-33.55%
jan 1, 1969
2.097
+0.289
15.97%
jan 1, 1970
4.065
+1.967
93.78%
jan 1, 1971
1.243
-2.821
-69.41%
jan 1, 1972
1.158
-0.085
-6.86%
jan 1, 1973
1.016
-0.142
-12.25%
jan 1, 1974
0.98
-0.036
-3.57%
jan 1, 1975
0.93
-0.049
-5.05%
jan 1, 1976
0.984
+0.053
5.75%
jan 1, 1977
0.903
-0.081
-8.25%
jan 1, 1978
0.565
-0.337
-37.37%
jan 1, 1979
0.518
-0.047
-8.31%
jan 1, 1980
0.667
+0.149
28.73%
jan 1, 1981
0.691
+0.024
3.54%
jan 1, 1982
0.408
-0.282
-40.89%
jan 1, 1983
0.598
+0.19
46.5%
jan 1, 1984
0.686
+0.088
14.69%
jan 1, 1985
0.659
-0.028
-4.02%
jan 1, 1986
0.903
+0.244
37.08%
jan 1, 1987
14.853
+13.951
1.55K%
jan 1, 1988
40.043
+25.189
169.59%
jan 1, 1989
41.031
+0.989
2.47%
jan 1, 1990
43.919
+2.888
7.04%
jan 1, 1991
41.591
-2.328
-5.3%
jan 1, 1992
39.203
-2.388
-5.74%
jan 1, 1993
42.193
+2.99
7.63%
jan 1, 1994
40.981
-1.212
-2.87%
jan 1, 1995
39.72
-1.261
-3.08%
jan 1, 1996
39.866
+0.146
0.37%
jan 1, 1997
36.956
-2.91
-7.3%
jan 1, 1998
34.471
-2.485
-6.72%
jan 1, 1999
32.283
-2.188
-6.35%
jan 1, 2000
26.795
-5.487
-17.0%
jan 1, 2001
28.797
+2.001
7.47%
jan 1, 2002
28.67
-0.126
-0.44%
jan 1, 2003
27.456
-1.214
-4.23%
jan 1, 2004
24.951
-2.506
-9.13%
jan 1, 2005
24.704
-0.247
-0.99%
jan 1, 2006
24.932
+0.228
0.92%
jan 1, 2007
21.699
-3.232
-12.96%
jan 1, 2008
19.746
-1.954
-9.0%
jan 1, 2009
17.203
-2.543
-12.88%
jan 1, 2010
14.318
-2.885
-16.77%
jan 1, 2011
14.547
+0.229
1.6%
jan 1, 2012
17.105
+2.558
17.58%
jan 1, 2013
20.081
+2.976
17.4%
jan 1, 2014
18.613
-1.468
-7.31%
jan 1, 2015
15.463
-3.15
-16.92%
Ranking of countries by current statistics by years


Comments: