29
/
en
AIzaSyAYiBZKx7MnpbEhh9jyipgxe19OcubqV5w
April 1, 2024
29004
East Asia & Pacific (IDA & IBRD countries)
TEA
false
2
1
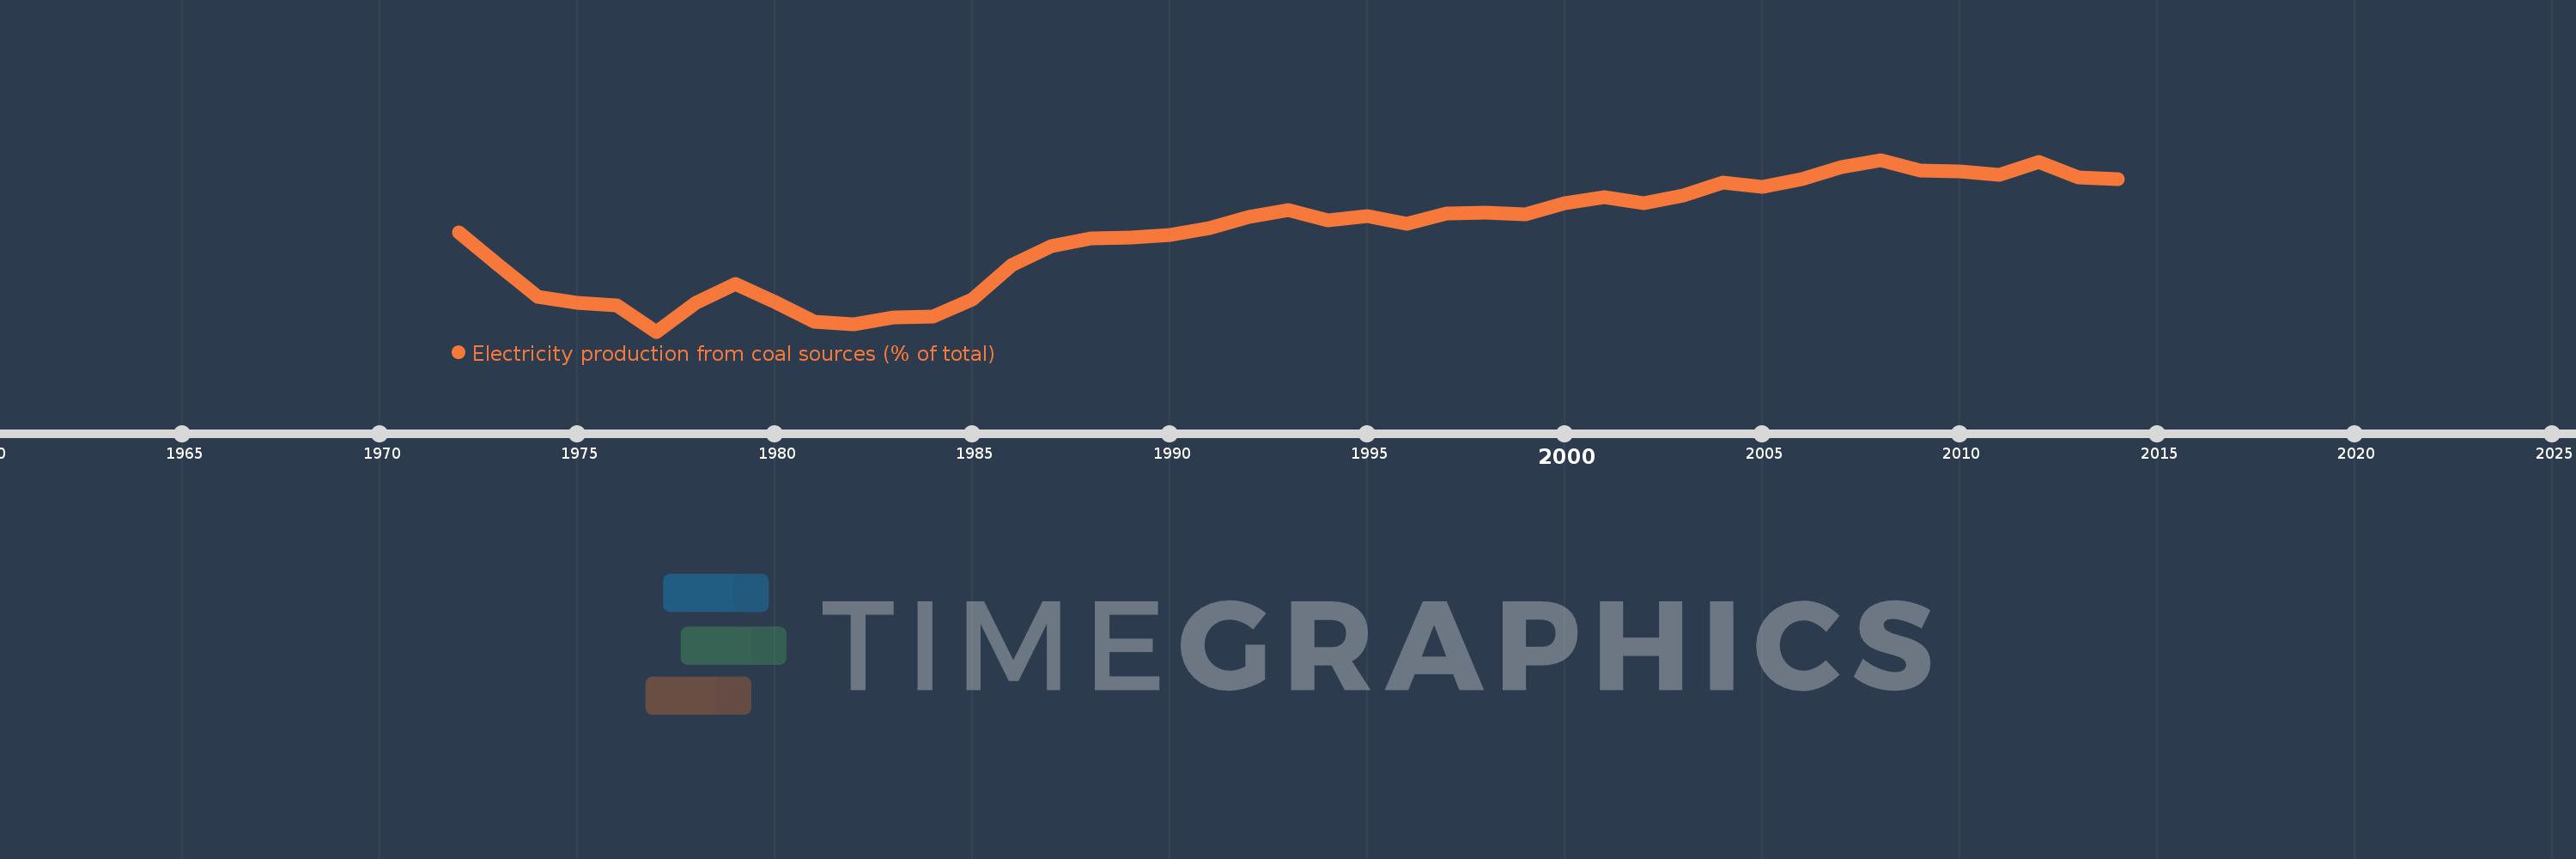
Electricity production from coal sources (% of total)
2014,2013,2012,2011,2010,2009,2008,2007,2006,2005,2004,2003,2002,2001,2000,1999,1998,1997,1996,1995,1994,1993,1992,1991,1990,1989,1988,1987,1986,1985,1984,1983,1982,1981,1980,1979,1978,1977,1976,1975,1974,1973,1972
This statistics in other country:
AlbaniaAlgeriaAngolaArab WorldArgentinaArmeniaAustraliaAustriaAzerbaijanBahrainBangladeshBelarusBelgiumBeninBoliviaBosnia and HerzegovinaBotswanaBrazilBrunei DarussalamBulgariaCambodiaCameroonCanadaCentral Europe and the BalticsChileChinaColombiaCongo, Dem. Rep.Congo, Rep.Costa RicaCote d'IvoireCroatiaCubaCuracaoCyprusCzech RepublicDenmarkDominican RepublicEarly-demographic dividendEast Asia & PacificEast Asia & Pacific (excluding high income)East Asia & Pacific (IDA & IBRD countries)EcuadorEgypt, Arab Rep.El SalvadorEritreaEstoniaEthiopiaEuro areaEurope & Central AsiaEurope & Central Asia (excluding high income)Europe & Central Asia (IDA & IBRD countries)European UnionFinlandFragile and conflict affected situationsFranceGabonGeorgiaGermanyGhanaGibraltarGreeceGuatemalaHaitiHeavily indebted poor countries (HIPC)High incomeHondurasHong Kong SAR, ChinaHungaryIBRD onlyIcelandIDA & IBRD totalIDA blendIDA onlyIDA totalIndiaIndonesiaIran, Islamic Rep.IraqIrelandIsraelItalyJamaicaJapanJordanKazakhstanKenyaKorea, Dem. People’s Rep.Korea, Rep.KosovoKuwaitKyrgyz RepublicLate-demographic dividendLatin America & Caribbean Latin America & Caribbean (excluding high income)Latin America & the Caribbean (IDA & IBRD countries)LatviaLeast developed countries: UN classificationLebanonLibyaLithuaniaLow & middle incomeLower middle incomeLuxembourgMacedonia, FYRMalaysiaMaltaMauritiusMexicoMiddle East & North AfricaMiddle East & North Africa (excluding high income)Middle East & North Africa (IDA & IBRD countries)Middle incomeMoldovaMongoliaMontenegroMoroccoMozambiqueMyanmarNamibiaNepalNetherlandsNew ZealandNicaraguaNigerNigeriaNorth AmericaNorwayOECD membersOmanOther small statesPakistanPanamaParaguayPeruPhilippinesPolandPortugalPost-demographic dividendPre-demographic dividendQatarRomaniaRussian FederationSaudi ArabiaSenegalSerbiaSingaporeSlovak RepublicSloveniaSmall statesSouth AfricaSouth AsiaSouth Asia (IDA & IBRD)South SudanSpainSri LankaSub-Saharan Africa Sub-Saharan Africa (excluding high income)Sub-Saharan Africa (IDA & IBRD countries)SudanSwedenSwitzerlandSyrian Arab RepublicTajikistanTanzaniaThailandTogoTrinidad and TobagoTunisiaTurkeyTurkmenistanUkraineUnited Arab EmiratesUnited KingdomUnited StatesUpper middle incomeUruguayUzbekistanVenezuela, RBVietnamWorldYemen, Rep.ZambiaZimbabwe Timeline:
This timeline shows a graph from 1972 to 2014 of East Asia & Pacific (IDA & IBRD countries). No data until 1971. Number of actual observations by date: 43.
Source name:
World Development Indicators
Source organization:
IEA Statistics © OECD/IEA 2014 (http://www.iea.org/stats/index.asp), subject to https://www.iea.org/t&c/termsandconditions/
Categories, topics:
Energy & Mining, Climate Change, Infrastructure
Last updated:
apr 23, 2017
Indicators value changes by year
Minimum:
43.535
jan 1, 1977
Maximum:
73.702
jan 1, 2008
At the date of observation
Value
Absolute change
Change from previous value
jan 1, 1972
60.95
+60.95
0.0%
jan 1, 1973
55.174
-5.776
-9.48%
jan 1, 1974
49.711
-5.462
-9.9%
jan 1, 1975
48.533
-1.178
-2.37%
jan 1, 1976
48.137
-0.397
-0.82%
jan 1, 1977
43.535
-4.601
-9.56%
jan 1, 1978
48.659
+5.123
11.77%
jan 1, 1979
51.976
+3.318
6.82%
jan 1, 1980
48.695
-3.282
-6.31%
jan 1, 1981
45.266
-3.429
-7.04%
jan 1, 1982
44.767
-0.498
-1.1%
jan 1, 1983
46.007
+1.24
2.77%
jan 1, 1984
46.166
+0.159
0.35%
jan 1, 1985
49.235
+3.069
6.65%
jan 1, 1986
55.217
+5.982
12.15%
jan 1, 1987
58.521
+3.304
5.98%
jan 1, 1988
59.96
+1.438
2.46%
jan 1, 1989
59.999
+0.04
0.07%
jan 1, 1990
60.551
+0.552
0.92%
jan 1, 1991
61.754
+1.202
1.99%
jan 1, 1992
63.687
+1.933
3.13%
jan 1, 1993
64.842
+1.155
1.81%
jan 1, 1994
63.056
-1.787
-2.76%
jan 1, 1995
63.83
+0.774
1.23%
jan 1, 1996
62.514
-1.316
-2.06%
jan 1, 1997
64.323
+1.809
2.89%
jan 1, 1998
64.478
+0.155
0.24%
jan 1, 1999
64.066
-0.412
-0.64%
jan 1, 2000
66.078
+2.012
3.14%
jan 1, 2001
67.209
+1.131
1.71%
jan 1, 2002
66.079
-1.13
-1.68%
jan 1, 2003
67.498
+1.419
2.15%
jan 1, 2004
69.653
+2.155
3.19%
jan 1, 2005
68.978
-0.676
-0.97%
jan 1, 2006
70.377
+1.399
2.03%
jan 1, 2007
72.357
+1.98
2.81%
jan 1, 2008
73.702
+1.345
1.86%
jan 1, 2009
71.803
-1.899
-2.58%
jan 1, 2010
71.65
-0.153
-0.21%
jan 1, 2011
71.025
-0.625
-0.87%
jan 1, 2012
73.312
+2.286
3.22%
jan 1, 2013
70.576
-2.736
-3.73%
jan 1, 2014
70.345
-0.231
-0.33%
Ranking of countries by current statistics by years


Comments: