29
/
en
AIzaSyAYiBZKx7MnpbEhh9jyipgxe19OcubqV5w
April 1, 2024
24020
Arab World
ARB
false
2
1
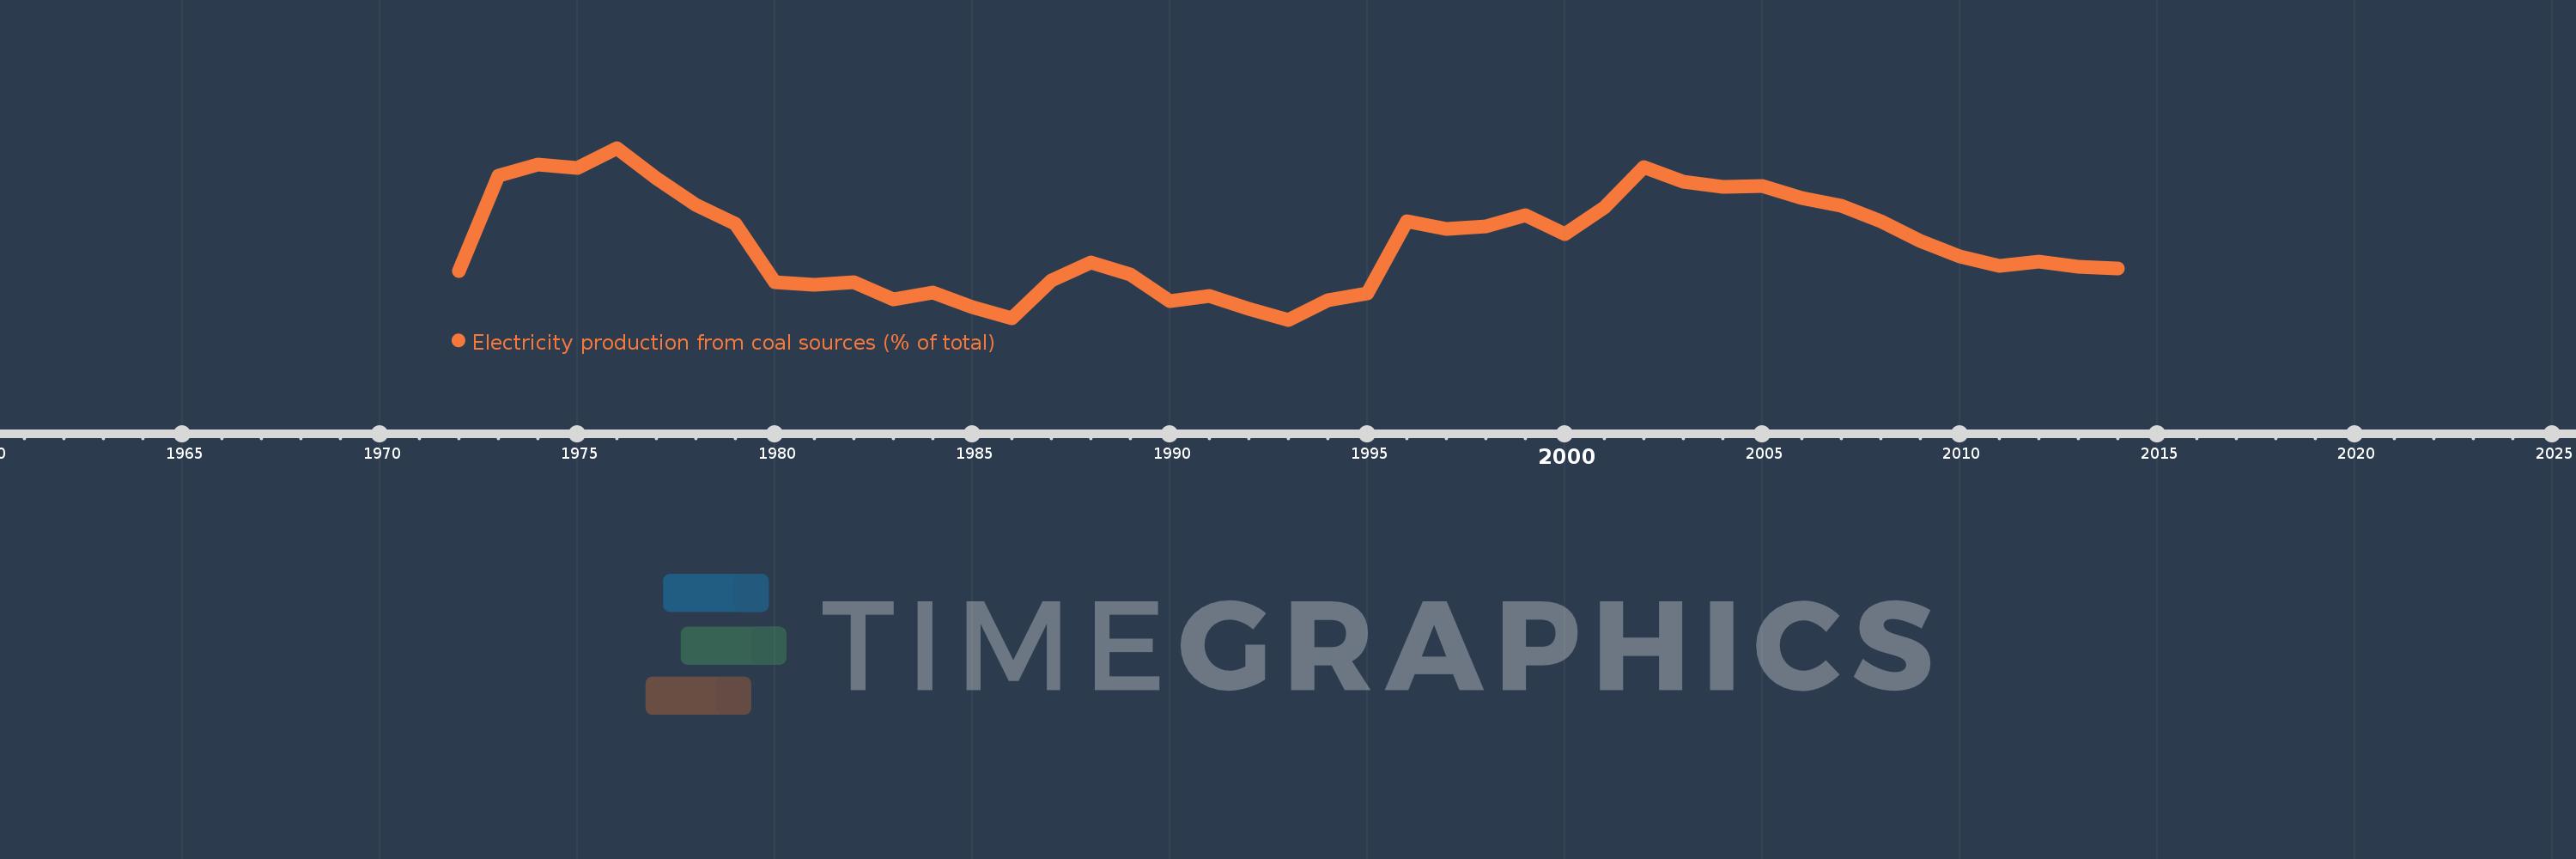
Electricity production from coal sources (% of total)
2014,2013,2012,2011,2010,2009,2008,2007,2006,2005,2004,2003,2002,2001,2000,1999,1998,1997,1996,1995,1994,1993,1992,1991,1990,1989,1988,1987,1986,1985,1984,1983,1982,1981,1980,1979,1978,1977,1976,1975,1974,1973,1972
This statistics in other country:
AlbaniaAlgeriaAngolaArab WorldArgentinaArmeniaAustraliaAustriaAzerbaijanBahrainBangladeshBelarusBelgiumBeninBoliviaBosnia and HerzegovinaBotswanaBrazilBrunei DarussalamBulgariaCambodiaCameroonCanadaCentral Europe and the BalticsChileChinaColombiaCongo, Dem. Rep.Congo, Rep.Costa RicaCote d'IvoireCroatiaCubaCuracaoCyprusCzech RepublicDenmarkDominican RepublicEarly-demographic dividendEast Asia & PacificEast Asia & Pacific (excluding high income)East Asia & Pacific (IDA & IBRD countries)EcuadorEgypt, Arab Rep.El SalvadorEritreaEstoniaEthiopiaEuro areaEurope & Central AsiaEurope & Central Asia (excluding high income)Europe & Central Asia (IDA & IBRD countries)European UnionFinlandFragile and conflict affected situationsFranceGabonGeorgiaGermanyGhanaGibraltarGreeceGuatemalaHaitiHeavily indebted poor countries (HIPC)High incomeHondurasHong Kong SAR, ChinaHungaryIBRD onlyIcelandIDA & IBRD totalIDA blendIDA onlyIDA totalIndiaIndonesiaIran, Islamic Rep.IraqIrelandIsraelItalyJamaicaJapanJordanKazakhstanKenyaKorea, Dem. People’s Rep.Korea, Rep.KosovoKuwaitKyrgyz RepublicLate-demographic dividendLatin America & Caribbean Latin America & Caribbean (excluding high income)Latin America & the Caribbean (IDA & IBRD countries)LatviaLeast developed countries: UN classificationLebanonLibyaLithuaniaLow & middle incomeLower middle incomeLuxembourgMacedonia, FYRMalaysiaMaltaMauritiusMexicoMiddle East & North AfricaMiddle East & North Africa (excluding high income)Middle East & North Africa (IDA & IBRD countries)Middle incomeMoldovaMongoliaMontenegroMoroccoMozambiqueMyanmarNamibiaNepalNetherlandsNew ZealandNicaraguaNigerNigeriaNorth AmericaNorwayOECD membersOmanOther small statesPakistanPanamaParaguayPeruPhilippinesPolandPortugalPost-demographic dividendPre-demographic dividendQatarRomaniaRussian FederationSaudi ArabiaSenegalSerbiaSingaporeSlovak RepublicSloveniaSmall statesSouth AfricaSouth AsiaSouth Asia (IDA & IBRD)South SudanSpainSri LankaSub-Saharan Africa Sub-Saharan Africa (excluding high income)Sub-Saharan Africa (IDA & IBRD countries)SudanSwedenSwitzerlandSyrian Arab RepublicTajikistanTanzaniaThailandTogoTrinidad and TobagoTunisiaTurkeyTurkmenistanUkraineUnited Arab EmiratesUnited KingdomUnited StatesUpper middle incomeUruguayUzbekistanVenezuela, RBVietnamWorldYemen, Rep.ZambiaZimbabwe Timeline:
This timeline shows a graph from 1972 to 2014 of Arab World. No data until 1971. Number of actual observations by date: 43.
Source name:
World Development Indicators
Source organization:
IEA Statistics © OECD/IEA 2014 (http://www.iea.org/stats/index.asp), subject to https://www.iea.org/t&c/termsandconditions/
Categories, topics:
Energy & Mining, Climate Change, Infrastructure
Last updated:
apr 23, 2017
Indicators value changes by year
At the date of observation
Value
Absolute change
Change from previous value
jan 1, 1972
1.169
+1.169
0.0%
jan 1, 1973
2.297
+1.128
96.56%
jan 1, 1974
2.433
+0.136
5.92%
jan 1, 1975
2.392
-0.042
-1.71%
jan 1, 1976
2.631
+0.24
10.02%
jan 1, 1977
2.269
-0.362
-13.76%
jan 1, 1978
1.956
-0.313
-13.79%
jan 1, 1979
1.732
-0.224
-11.44%
jan 1, 1980
1.034
-0.698
-40.3%
jan 1, 1981
1.012
-0.022
-2.11%
jan 1, 1982
1.037
+0.024
2.4%
jan 1, 1983
0.836
-0.2
-19.33%
jan 1, 1984
0.916
+0.08
9.53%
jan 1, 1985
0.739
-0.177
-19.34%
jan 1, 1986
0.614
-0.124
-16.84%
jan 1, 1987
1.057
+0.443
72.07%
jan 1, 1988
1.271
+0.214
20.22%
jan 1, 1989
1.129
-0.142
-11.19%
jan 1, 1990
0.817
-0.312
-27.6%
jan 1, 1991
0.878
+0.061
7.47%
jan 1, 1992
0.722
-0.156
-17.75%
jan 1, 1993
0.594
-0.128
-17.77%
jan 1, 1994
0.829
+0.235
39.59%
jan 1, 1995
0.909
+0.08
9.64%
jan 1, 1996
1.767
+0.858
94.42%
jan 1, 1997
1.67
-0.098
-5.54%
jan 1, 1998
1.7
+0.031
1.84%
jan 1, 1999
1.838
+0.138
8.09%
jan 1, 2000
1.61
-0.228
-12.39%
jan 1, 2001
1.923
+0.313
19.45%
jan 1, 2002
2.402
+0.478
24.87%
jan 1, 2003
2.235
-0.167
-6.94%
jan 1, 2004
2.167
-0.068
-3.03%
jan 1, 2005
2.178
+0.011
0.51%
jan 1, 2006
2.037
-0.141
-6.46%
jan 1, 2007
1.941
-0.096
-4.72%
jan 1, 2008
1.763
-0.179
-9.2%
jan 1, 2009
1.53
-0.233
-13.23%
jan 1, 2010
1.346
-0.184
-12.02%
jan 1, 2011
1.233
-0.112
-8.33%
jan 1, 2012
1.283
+0.05
4.02%
jan 1, 2013
1.22
-0.064
-4.95%
jan 1, 2014
1.199
-0.021
-1.71%
Ranking of countries by current statistics by years


Comments: