29
/
en
AIzaSyAYiBZKx7MnpbEhh9jyipgxe19OcubqV5w
April 1, 2024
169228
Korea, Dem. People’s Rep.
PRK
true
2
1
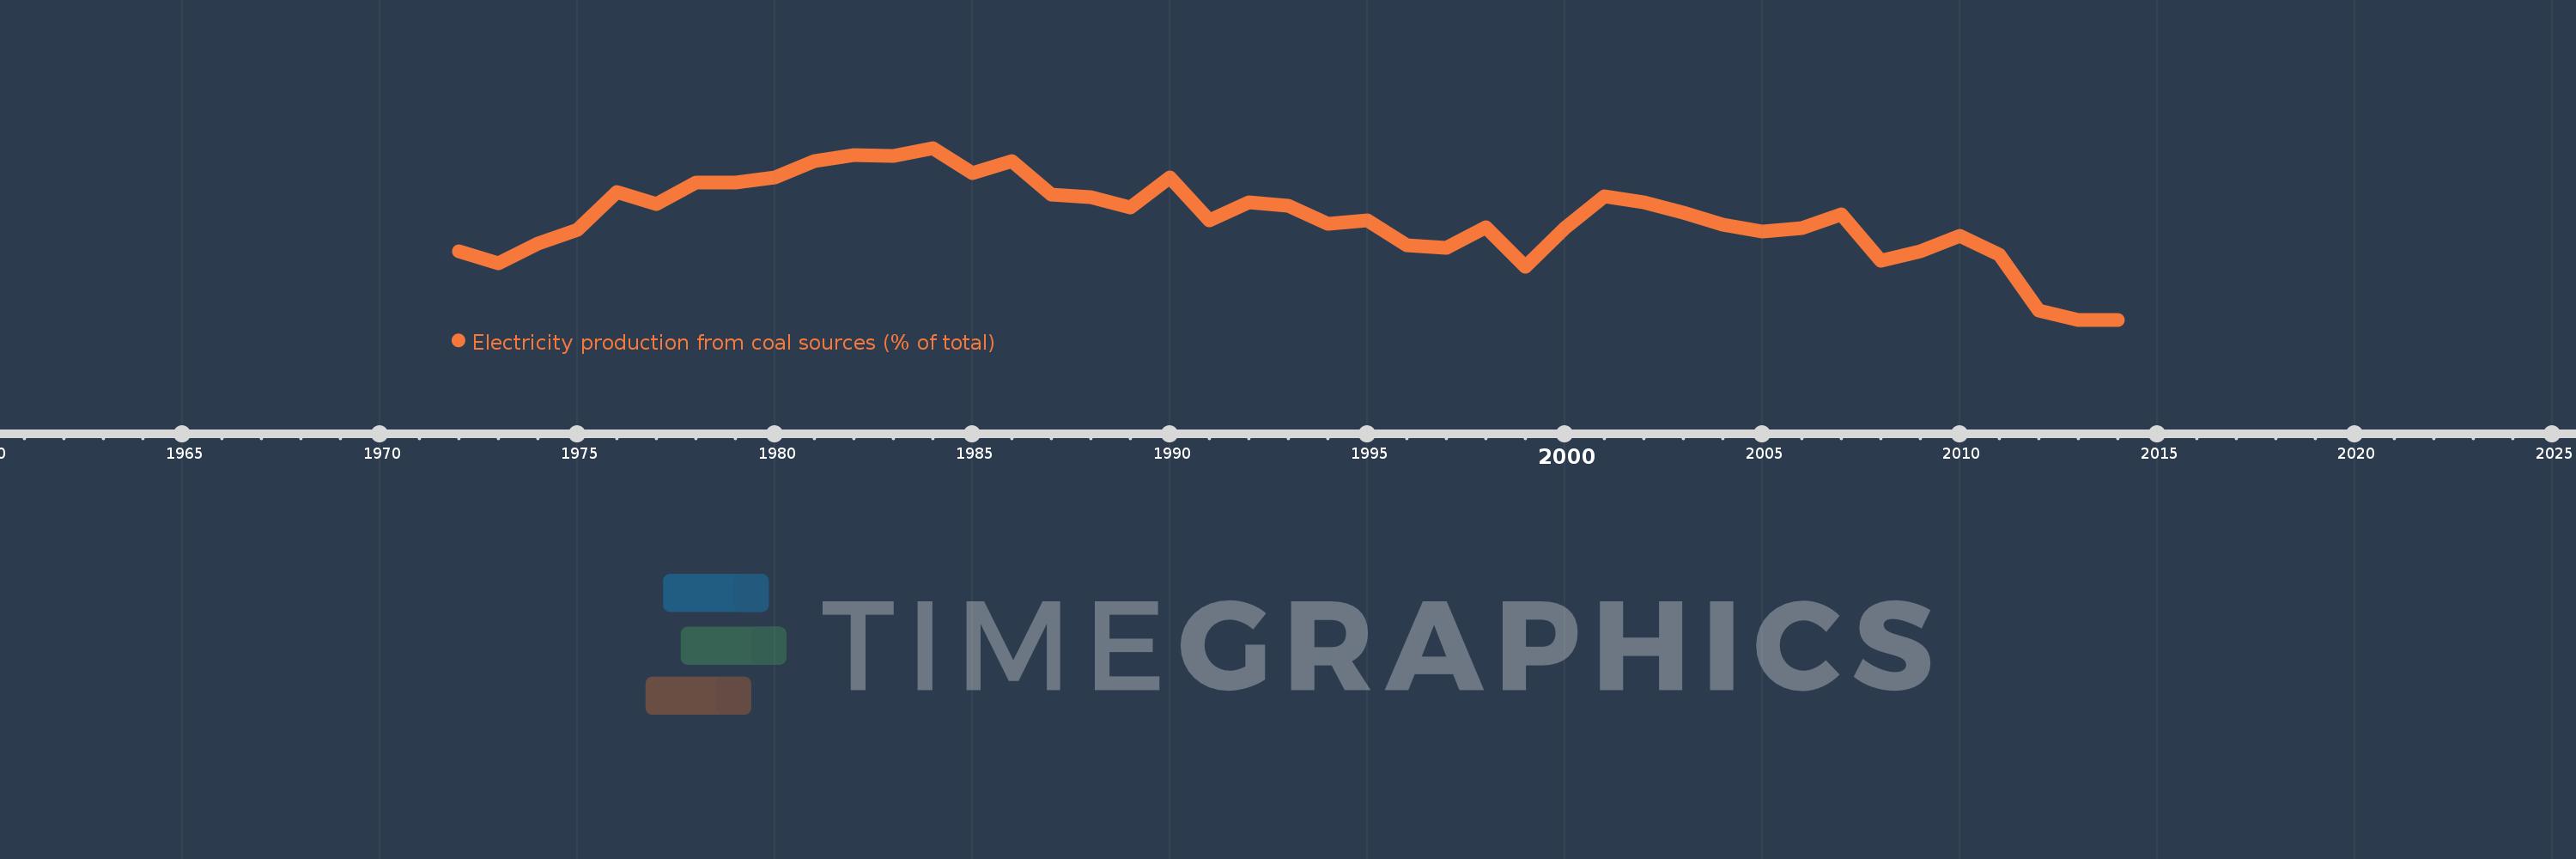
Electricity production from coal sources (% of total)
2014,2013,2012,2011,2010,2009,2008,2007,2006,2005,2004,2003,2002,2001,2000,1999,1998,1997,1996,1995,1994,1993,1992,1991,1990,1989,1988,1987,1986,1985,1984,1983,1982,1981,1980,1979,1978,1977,1976,1975,1974,1973,1972
This statistics in other country:
AlbaniaAlgeriaAngolaArab WorldArgentinaArmeniaAustraliaAustriaAzerbaijanBahrainBangladeshBelarusBelgiumBeninBoliviaBosnia and HerzegovinaBotswanaBrazilBrunei DarussalamBulgariaCambodiaCameroonCanadaCentral Europe and the BalticsChileChinaColombiaCongo, Dem. Rep.Congo, Rep.Costa RicaCote d'IvoireCroatiaCubaCuracaoCyprusCzech RepublicDenmarkDominican RepublicEarly-demographic dividendEast Asia & PacificEast Asia & Pacific (excluding high income)East Asia & Pacific (IDA & IBRD countries)EcuadorEgypt, Arab Rep.El SalvadorEritreaEstoniaEthiopiaEuro areaEurope & Central AsiaEurope & Central Asia (excluding high income)Europe & Central Asia (IDA & IBRD countries)European UnionFinlandFragile and conflict affected situationsFranceGabonGeorgiaGermanyGhanaGibraltarGreeceGuatemalaHaitiHeavily indebted poor countries (HIPC)High incomeHondurasHong Kong SAR, ChinaHungaryIBRD onlyIcelandIDA & IBRD totalIDA blendIDA onlyIDA totalIndiaIndonesiaIran, Islamic Rep.IraqIrelandIsraelItalyJamaicaJapanJordanKazakhstanKenyaKorea, Dem. People’s Rep.Korea, Rep.KosovoKuwaitKyrgyz RepublicLate-demographic dividendLatin America & Caribbean Latin America & Caribbean (excluding high income)Latin America & the Caribbean (IDA & IBRD countries)LatviaLeast developed countries: UN classificationLebanonLibyaLithuaniaLow & middle incomeLower middle incomeLuxembourgMacedonia, FYRMalaysiaMaltaMauritiusMexicoMiddle East & North AfricaMiddle East & North Africa (excluding high income)Middle East & North Africa (IDA & IBRD countries)Middle incomeMoldovaMongoliaMontenegroMoroccoMozambiqueMyanmarNamibiaNepalNetherlandsNew ZealandNicaraguaNigerNigeriaNorth AmericaNorwayOECD membersOmanOther small statesPakistanPanamaParaguayPeruPhilippinesPolandPortugalPost-demographic dividendPre-demographic dividendQatarRomaniaRussian FederationSaudi ArabiaSenegalSerbiaSingaporeSlovak RepublicSloveniaSmall statesSouth AfricaSouth AsiaSouth Asia (IDA & IBRD)South SudanSpainSri LankaSub-Saharan Africa Sub-Saharan Africa (excluding high income)Sub-Saharan Africa (IDA & IBRD countries)SudanSwedenSwitzerlandSyrian Arab RepublicTajikistanTanzaniaThailandTogoTrinidad and TobagoTunisiaTurkeyTurkmenistanUkraineUnited Arab EmiratesUnited KingdomUnited StatesUpper middle incomeUruguayUzbekistanVenezuela, RBVietnamWorldYemen, Rep.ZambiaZimbabwe Timeline:
This timeline shows a graph from 1972 to 2014 of Korea, Dem. People’s Rep.. No data until 1971. Number of actual observations by date: 43.
Source name:
World Development Indicators
Source organization:
IEA Statistics © OECD/IEA 2014 (http://www.iea.org/stats/index.asp), subject to https://www.iea.org/t&c/termsandconditions/
Categories, topics:
Energy & Mining, Climate Change, Infrastructure
Last updated:
apr 23, 2017
Indicators value changes by year
Minimum:
26.946
jan 1, 2014
At the date of observation
Value
Absolute change
Change from previous value
jan 1, 1972
35.983
+35.983
0.0%
jan 1, 1973
34.447
-1.536
-4.27%
jan 1, 1974
37.002
+2.556
7.42%
jan 1, 1975
38.842
+1.839
4.97%
jan 1, 1976
43.869
+5.027
12.94%
jan 1, 1977
42.288
-1.581
-3.6%
jan 1, 1978
45.067
+2.779
6.57%
jan 1, 1979
45.11
+0.043
0.1%
jan 1, 1980
45.781
+0.671
1.49%
jan 1, 1981
47.986
+2.205
4.82%
jan 1, 1982
48.765
+0.779
1.62%
jan 1, 1983
48.681
-0.084
-0.17%
jan 1, 1984
49.69
+1.01
2.07%
jan 1, 1985
46.403
-3.287
-6.62%
jan 1, 1986
47.936
+1.533
3.3%
jan 1, 1987
43.49
-4.446
-9.28%
jan 1, 1988
43.138
-0.352
-0.81%
jan 1, 1989
41.821
-1.317
-3.05%
jan 1, 1990
45.815
+3.994
9.55%
jan 1, 1991
40.051
-5.765
-12.58%
jan 1, 1992
42.498
+2.448
6.11%
jan 1, 1993
42.057
-0.441
-1.04%
jan 1, 1994
39.688
-2.369
-5.63%
jan 1, 1995
40.121
+0.433
1.09%
jan 1, 1996
36.804
-3.317
-8.27%
jan 1, 1997
36.469
-0.335
-0.91%
jan 1, 1998
39.212
+2.743
7.52%
jan 1, 1999
33.929
-5.283
-13.47%
jan 1, 2000
39.075
+5.146
15.17%
jan 1, 2001
43.314
+4.239
10.85%
jan 1, 2002
42.515
-0.8
-1.85%
jan 1, 2003
41.171
-1.344
-3.16%
jan 1, 2004
39.485
-1.686
-4.1%
jan 1, 2005
38.579
-0.906
-2.29%
jan 1, 2006
39.041
+0.462
1.2%
jan 1, 2007
40.9
+1.86
4.76%
jan 1, 2008
34.758
-6.142
-15.02%
jan 1, 2009
36.005
+1.247
3.59%
jan 1, 2010
38.013
+2.008
5.58%
jan 1, 2011
35.515
-2.498
-6.57%
jan 1, 2012
28.139
-7.376
-20.77%
jan 1, 2013
26.949
-1.19
-4.23%
jan 1, 2014
26.946
-0.003
-0.01%
Ranking of countries by current statistics by years


Comments: