29
/
en
AIzaSyAYiBZKx7MnpbEhh9jyipgxe19OcubqV5w
April 1, 2024
25602
Central Europe and the Baltics
CEB
false
2
1
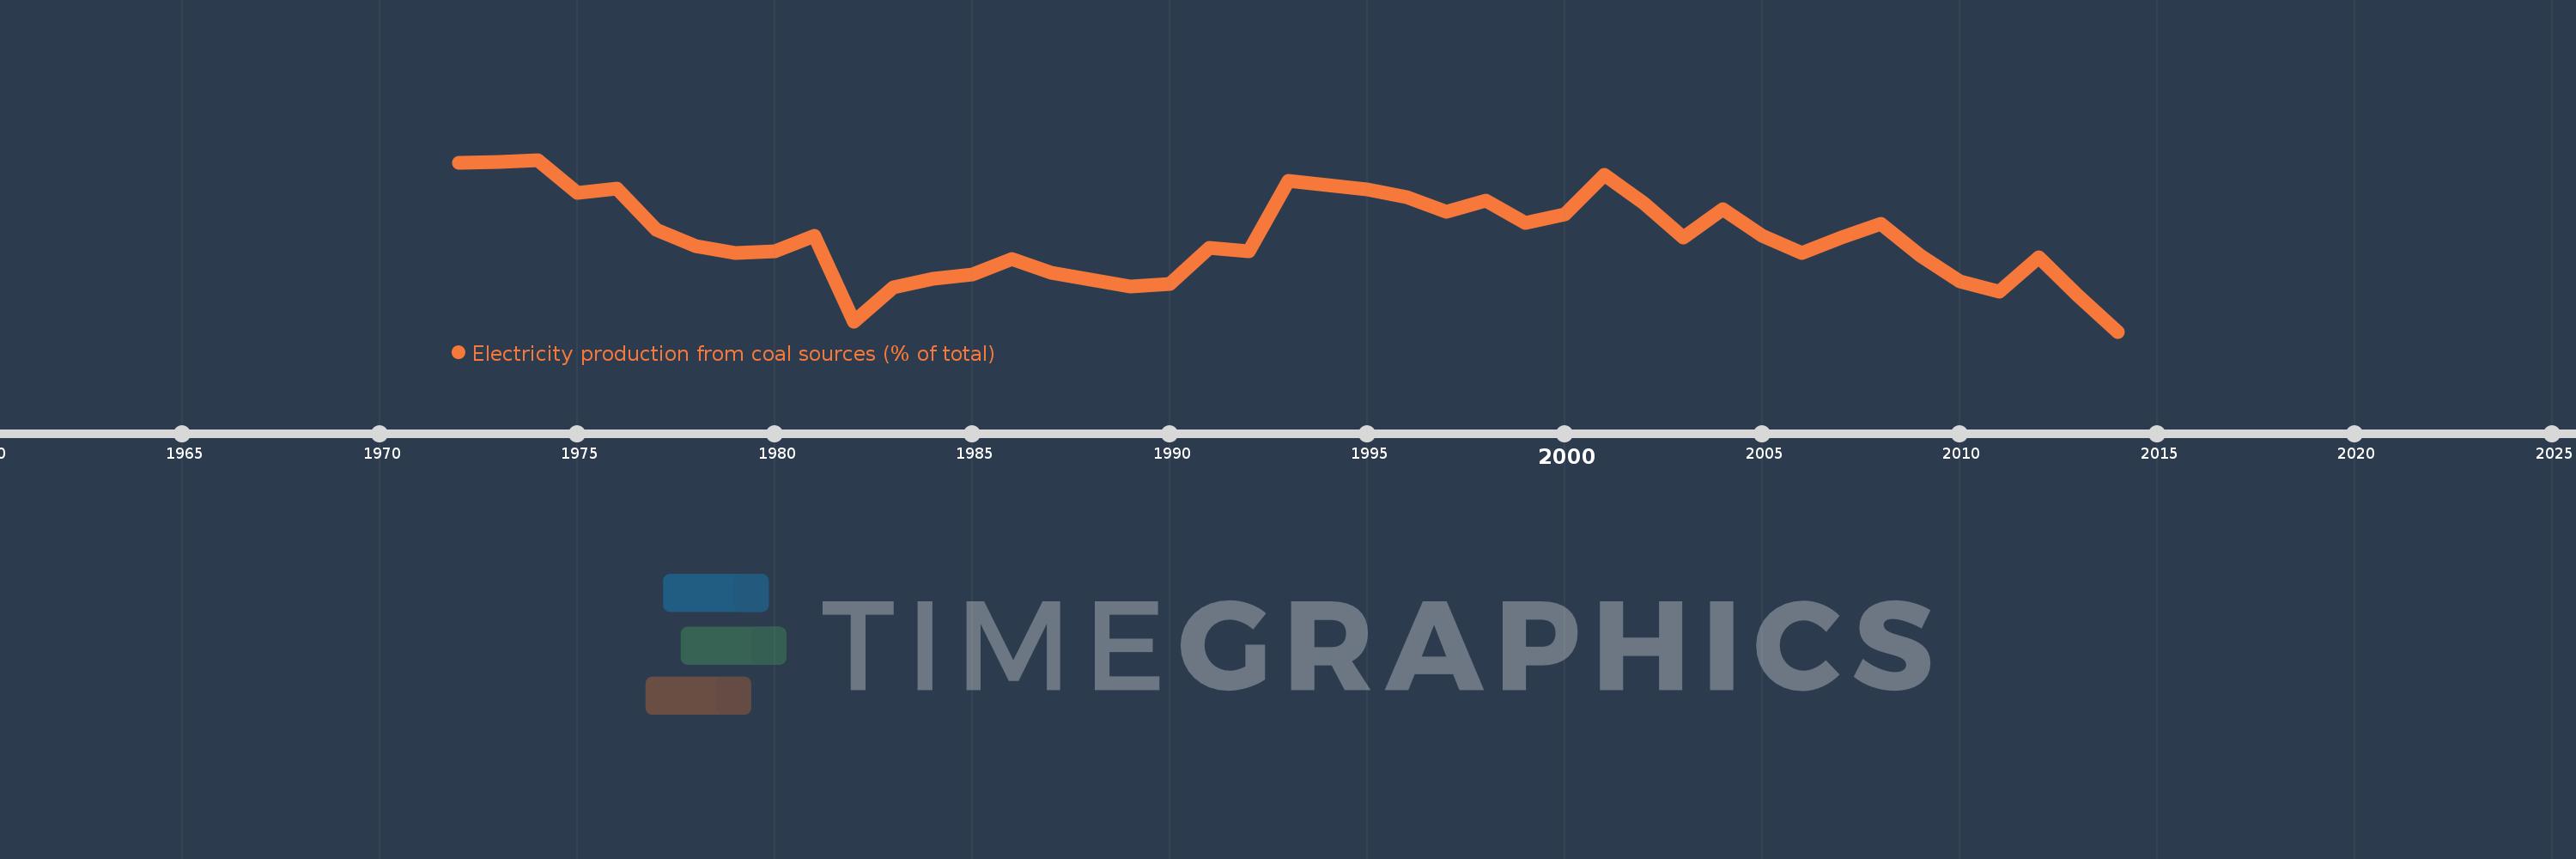
Electricity production from coal sources (% of total)
2014,2013,2012,2011,2010,2009,2008,2007,2006,2005,2004,2003,2002,2001,2000,1999,1998,1997,1996,1995,1994,1993,1992,1991,1990,1989,1988,1987,1986,1985,1984,1983,1982,1981,1980,1979,1978,1977,1976,1975,1974,1973,1972
This statistics in other country:
AlbaniaAlgeriaAngolaArab WorldArgentinaArmeniaAustraliaAustriaAzerbaijanBahrainBangladeshBelarusBelgiumBeninBoliviaBosnia and HerzegovinaBotswanaBrazilBrunei DarussalamBulgariaCambodiaCameroonCanadaCentral Europe and the BalticsChileChinaColombiaCongo, Dem. Rep.Congo, Rep.Costa RicaCote d'IvoireCroatiaCubaCuracaoCyprusCzech RepublicDenmarkDominican RepublicEarly-demographic dividendEast Asia & PacificEast Asia & Pacific (excluding high income)East Asia & Pacific (IDA & IBRD countries)EcuadorEgypt, Arab Rep.El SalvadorEritreaEstoniaEthiopiaEuro areaEurope & Central AsiaEurope & Central Asia (excluding high income)Europe & Central Asia (IDA & IBRD countries)European UnionFinlandFragile and conflict affected situationsFranceGabonGeorgiaGermanyGhanaGibraltarGreeceGuatemalaHaitiHeavily indebted poor countries (HIPC)High incomeHondurasHong Kong SAR, ChinaHungaryIBRD onlyIcelandIDA & IBRD totalIDA blendIDA onlyIDA totalIndiaIndonesiaIran, Islamic Rep.IraqIrelandIsraelItalyJamaicaJapanJordanKazakhstanKenyaKorea, Dem. People’s Rep.Korea, Rep.KosovoKuwaitKyrgyz RepublicLate-demographic dividendLatin America & Caribbean Latin America & Caribbean (excluding high income)Latin America & the Caribbean (IDA & IBRD countries)LatviaLeast developed countries: UN classificationLebanonLibyaLithuaniaLow & middle incomeLower middle incomeLuxembourgMacedonia, FYRMalaysiaMaltaMauritiusMexicoMiddle East & North AfricaMiddle East & North Africa (excluding high income)Middle East & North Africa (IDA & IBRD countries)Middle incomeMoldovaMongoliaMontenegroMoroccoMozambiqueMyanmarNamibiaNepalNetherlandsNew ZealandNicaraguaNigerNigeriaNorth AmericaNorwayOECD membersOmanOther small statesPakistanPanamaParaguayPeruPhilippinesPolandPortugalPost-demographic dividendPre-demographic dividendQatarRomaniaRussian FederationSaudi ArabiaSenegalSerbiaSingaporeSlovak RepublicSloveniaSmall statesSouth AfricaSouth AsiaSouth Asia (IDA & IBRD)South SudanSpainSri LankaSub-Saharan Africa Sub-Saharan Africa (excluding high income)Sub-Saharan Africa (IDA & IBRD countries)SudanSwedenSwitzerlandSyrian Arab RepublicTajikistanTanzaniaThailandTogoTrinidad and TobagoTunisiaTurkeyTurkmenistanUkraineUnited Arab EmiratesUnited KingdomUnited StatesUpper middle incomeUruguayUzbekistanVenezuela, RBVietnamWorldYemen, Rep.ZambiaZimbabwe Timeline:
This timeline shows a graph from 1972 to 2014 of Central Europe and the Baltics. No data until 1971. Number of actual observations by date: 43.
Source name:
World Development Indicators
Source organization:
IEA Statistics © OECD/IEA 2014 (http://www.iea.org/stats/index.asp), subject to https://www.iea.org/t&c/termsandconditions/
Categories, topics:
Energy & Mining, Climate Change, Infrastructure
Last updated:
apr 23, 2017
Indicators value changes by year
Minimum:
51.337
jan 1, 2014
Maximum:
60.263
jan 1, 1974
At the date of observation
Value
Absolute change
Change from previous value
jan 1, 1972
60.088
+60.088
0.0%
jan 1, 1973
60.145
+0.057
0.09%
jan 1, 1974
60.263
+0.119
0.2%
jan 1, 1975
58.562
-1.702
-2.82%
jan 1, 1976
58.774
+0.213
0.36%
jan 1, 1977
56.609
-2.165
-3.68%
jan 1, 1978
55.773
-0.836
-1.48%
jan 1, 1979
55.409
-0.365
-0.65%
jan 1, 1980
55.498
+0.089
0.16%
jan 1, 1981
56.325
+0.827
1.49%
jan 1, 1982
51.852
-4.472
-7.94%
jan 1, 1983
53.629
+1.776
3.43%
jan 1, 1984
54.091
+0.462
0.86%
jan 1, 1985
54.315
+0.224
0.41%
jan 1, 1986
55.122
+0.807
1.49%
jan 1, 1987
54.392
-0.73
-1.32%
jan 1, 1988
54.023
-0.369
-0.68%
jan 1, 1989
53.694
-0.329
-0.61%
jan 1, 1990
53.795
+0.102
0.19%
jan 1, 1991
55.7
+1.905
3.54%
jan 1, 1992
55.521
-0.179
-0.32%
jan 1, 1993
59.171
+3.65
6.57%
jan 1, 1994
58.928
-0.242
-0.41%
jan 1, 1995
58.701
-0.227
-0.39%
jan 1, 1996
58.301
-0.4
-0.68%
jan 1, 1997
57.545
-0.756
-1.3%
jan 1, 1998
58.159
+0.613
1.07%
jan 1, 1999
56.963
-1.196
-2.06%
jan 1, 2000
57.419
+0.456
0.8%
jan 1, 2001
59.503
+2.084
3.63%
jan 1, 2002
58.016
-1.487
-2.5%
jan 1, 2003
56.227
-1.789
-3.08%
jan 1, 2004
57.712
+1.485
2.64%
jan 1, 2005
56.326
-1.385
-2.4%
jan 1, 2006
55.408
-0.919
-1.63%
jan 1, 2007
56.228
+0.82
1.48%
jan 1, 2008
56.935
+0.707
1.26%
jan 1, 2009
55.266
-1.669
-2.93%
jan 1, 2010
53.96
-1.305
-2.36%
jan 1, 2011
53.424
-0.536
-0.99%
jan 1, 2012
55.208
+1.784
3.34%
jan 1, 2013
53.192
-2.016
-3.65%
jan 1, 2014
51.337
-1.855
-3.49%
Ranking of countries by current statistics by years


Comments: