29
/
en
AIzaSyAYiBZKx7MnpbEhh9jyipgxe19OcubqV5w
April 1, 2024
60686
Sub-Saharan Africa (IDA & IBRD countries)
TSS
false
2
1
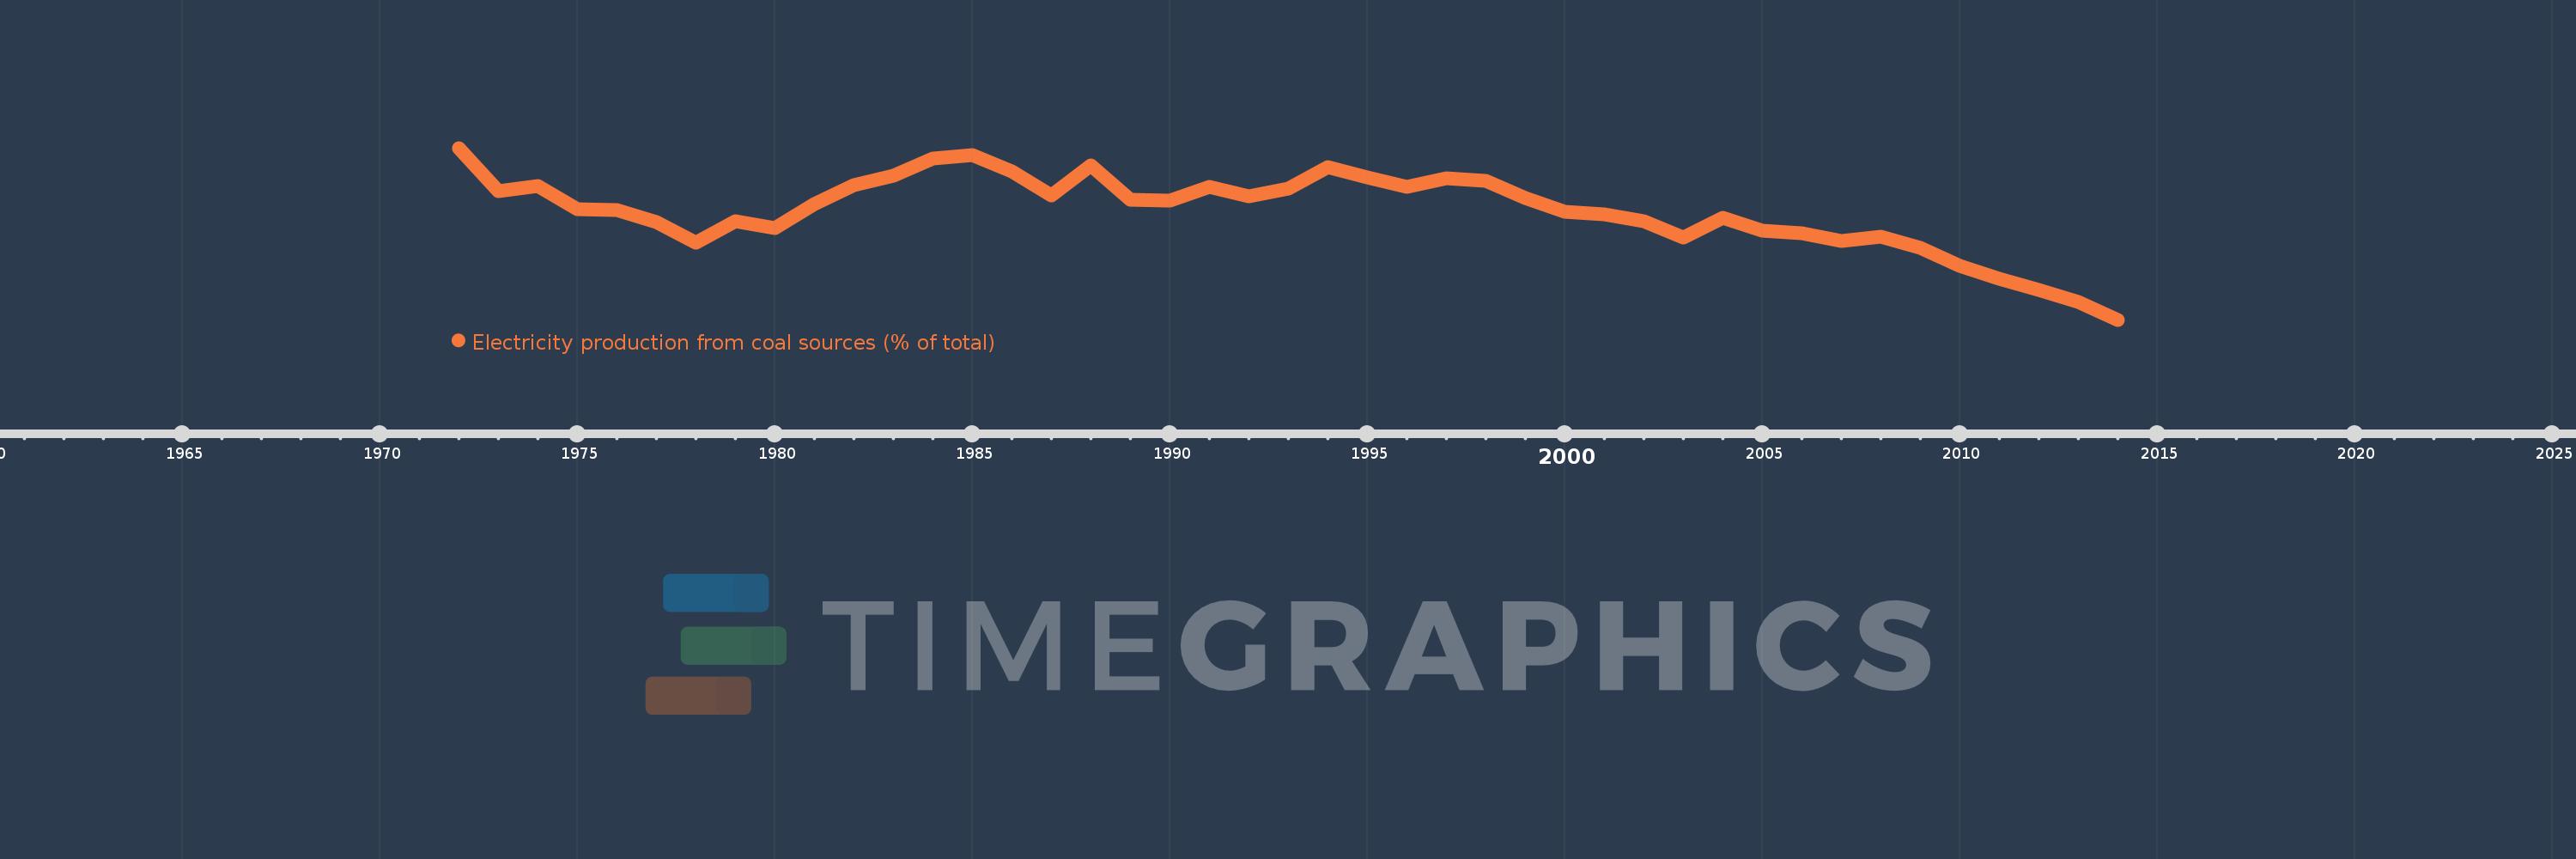
Electricity production from coal sources (% of total)
2014,2013,2012,2011,2010,2009,2008,2007,2006,2005,2004,2003,2002,2001,2000,1999,1998,1997,1996,1995,1994,1993,1992,1991,1990,1989,1988,1987,1986,1985,1984,1983,1982,1981,1980,1979,1978,1977,1976,1975,1974,1973,1972
This statistics in other country:
AlbaniaAlgeriaAngolaArab WorldArgentinaArmeniaAustraliaAustriaAzerbaijanBahrainBangladeshBelarusBelgiumBeninBoliviaBosnia and HerzegovinaBotswanaBrazilBrunei DarussalamBulgariaCambodiaCameroonCanadaCentral Europe and the BalticsChileChinaColombiaCongo, Dem. Rep.Congo, Rep.Costa RicaCote d'IvoireCroatiaCubaCuracaoCyprusCzech RepublicDenmarkDominican RepublicEarly-demographic dividendEast Asia & PacificEast Asia & Pacific (excluding high income)East Asia & Pacific (IDA & IBRD countries)EcuadorEgypt, Arab Rep.El SalvadorEritreaEstoniaEthiopiaEuro areaEurope & Central AsiaEurope & Central Asia (excluding high income)Europe & Central Asia (IDA & IBRD countries)European UnionFinlandFragile and conflict affected situationsFranceGabonGeorgiaGermanyGhanaGibraltarGreeceGuatemalaHaitiHeavily indebted poor countries (HIPC)High incomeHondurasHong Kong SAR, ChinaHungaryIBRD onlyIcelandIDA & IBRD totalIDA blendIDA onlyIDA totalIndiaIndonesiaIran, Islamic Rep.IraqIrelandIsraelItalyJamaicaJapanJordanKazakhstanKenyaKorea, Dem. People’s Rep.Korea, Rep.KosovoKuwaitKyrgyz RepublicLate-demographic dividendLatin America & Caribbean Latin America & Caribbean (excluding high income)Latin America & the Caribbean (IDA & IBRD countries)LatviaLeast developed countries: UN classificationLebanonLibyaLithuaniaLow & middle incomeLower middle incomeLuxembourgMacedonia, FYRMalaysiaMaltaMauritiusMexicoMiddle East & North AfricaMiddle East & North Africa (excluding high income)Middle East & North Africa (IDA & IBRD countries)Middle incomeMoldovaMongoliaMontenegroMoroccoMozambiqueMyanmarNamibiaNepalNetherlandsNew ZealandNicaraguaNigerNigeriaNorth AmericaNorwayOECD membersOmanOther small statesPakistanPanamaParaguayPeruPhilippinesPolandPortugalPost-demographic dividendPre-demographic dividendQatarRomaniaRussian FederationSaudi ArabiaSenegalSerbiaSingaporeSlovak RepublicSloveniaSmall statesSouth AfricaSouth AsiaSouth Asia (IDA & IBRD)South SudanSpainSri LankaSub-Saharan Africa Sub-Saharan Africa (excluding high income)Sub-Saharan Africa (IDA & IBRD countries)SudanSwedenSwitzerlandSyrian Arab RepublicTajikistanTanzaniaThailandTogoTrinidad and TobagoTunisiaTurkeyTurkmenistanUkraineUnited Arab EmiratesUnited KingdomUnited StatesUpper middle incomeUruguayUzbekistanVenezuela, RBVietnamWorldYemen, Rep.ZambiaZimbabwe Timeline:
This timeline shows a graph from 1972 to 2014 of Sub-Saharan Africa (IDA & IBRD countries). No data until 1971. Number of actual observations by date: 43.
Source name:
World Development Indicators
Source organization:
IEA Statistics © OECD/IEA 2014 (http://www.iea.org/stats/index.asp), subject to https://www.iea.org/t&c/termsandconditions/
Categories, topics:
Energy & Mining, Climate Change, Infrastructure
Last updated:
apr 23, 2017
Indicators value changes by year
Minimum:
53.663
jan 1, 2014
Maximum:
67.282
jan 1, 1972
At the date of observation
Value
Absolute change
Change from previous value
jan 1, 1972
67.282
+67.282
0.0%
jan 1, 1973
63.89
-3.392
-5.04%
jan 1, 1974
64.291
+0.401
0.63%
jan 1, 1975
62.445
-1.846
-2.87%
jan 1, 1976
62.346
-0.1
-0.16%
jan 1, 1977
61.384
-0.962
-1.54%
jan 1, 1978
59.786
-1.599
-2.6%
jan 1, 1979
61.506
+1.721
2.88%
jan 1, 1980
60.897
-0.609
-0.99%
jan 1, 1981
62.869
+1.972
3.24%
jan 1, 1982
64.357
+1.488
2.37%
jan 1, 1983
65.091
+0.734
1.14%
jan 1, 1984
66.423
+1.333
2.05%
jan 1, 1985
66.716
+0.293
0.44%
jan 1, 1986
65.404
-1.312
-1.97%
jan 1, 1987
63.496
-1.908
-2.92%
jan 1, 1988
65.914
+2.418
3.81%
jan 1, 1989
63.158
-2.756
-4.18%
jan 1, 1990
63.082
-0.076
-0.12%
jan 1, 1991
64.213
+1.131
1.79%
jan 1, 1992
63.467
-0.746
-1.16%
jan 1, 1993
64.047
+0.58
0.91%
jan 1, 1994
65.766
+1.719
2.68%
jan 1, 1995
64.931
-0.835
-1.27%
jan 1, 1996
64.181
-0.749
-1.15%
jan 1, 1997
64.886
+0.704
1.1%
jan 1, 1998
64.698
-0.188
-0.29%
jan 1, 1999
63.336
-1.361
-2.1%
jan 1, 2000
62.191
-1.145
-1.81%
jan 1, 2001
62.0
-0.19
-0.31%
jan 1, 2002
61.454
-0.546
-0.88%
jan 1, 2003
60.213
-1.241
-2.02%
jan 1, 2004
61.773
+1.56
2.59%
jan 1, 2005
60.749
-1.024
-1.66%
jan 1, 2006
60.544
-0.205
-0.34%
jan 1, 2007
59.888
-0.656
-1.08%
jan 1, 2008
60.216
+0.328
0.55%
jan 1, 2009
59.377
-0.839
-1.39%
jan 1, 2010
57.955
-1.422
-2.39%
jan 1, 2011
56.894
-1.061
-1.83%
jan 1, 2012
56.031
-0.863
-1.52%
jan 1, 2013
55.086
-0.945
-1.69%
jan 1, 2014
53.663
-1.423
-2.58%
Ranking of countries by current statistics by years


Comments: