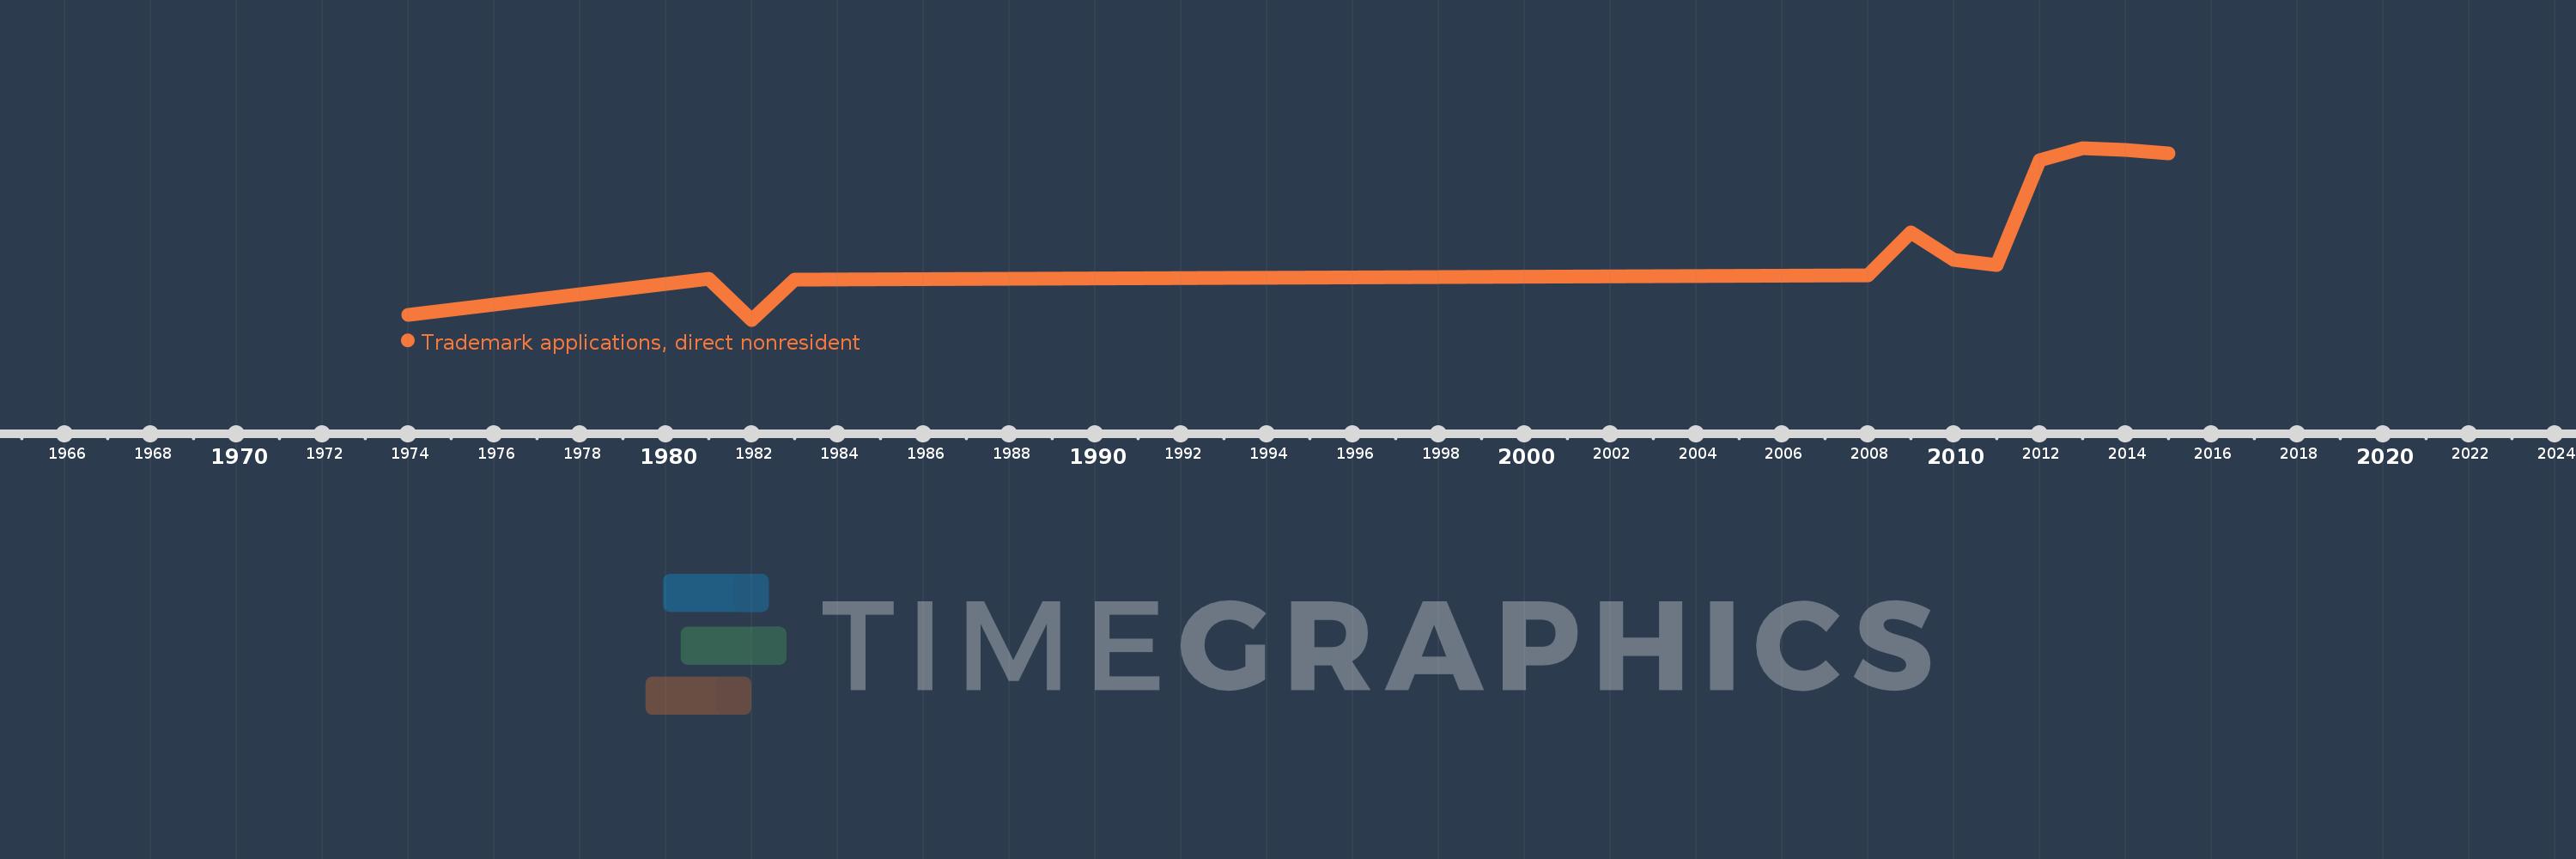
This timeline shows a graph from 1974 to 2015 of Botswana. No data until 1973. Number of actual observations by date: 12.
Source name:
World Development Indicators
Source organization:
World Intellectual Property Organization (WIPO), WIPO Patent Report: Statistics on Worldwide Patent Activity. The International Bureau of WIPO assumes no responsibility with respect to the transformation of these data.
Categories, topics:
Science & Technology
Last updated:
apr 23, 2017
Indicators value changes by year
Meaning:
890.083
Minimum:
262.0
jan 1, 1982
Maximum:
1.557K
jan 1, 2013
At the date of observation
Value
Absolute change
Change from the previous value
jan 1, 1974
301.0
+301.0
0.0%
jan 1, 1981
573.0
+272.0
90.37%
jan 1, 1982
262.0
-311.0
-54.28%
jan 1, 1983
566.0
+304.0
116.03%
jan 1, 2008
595.0
+29.0
5.12%
jan 1, 2009
920.0
+325.0
54.62%
jan 1, 2010
712.0
-208.0
-22.61%
jan 1, 2011
673.0
-39.0
-5.48%
jan 1, 2012
1.464K
+791.0
117.53%
jan 1, 2013
1.557K
+93.0
6.35%
jan 1, 2014
1.539K
-18.0
-1.16%
jan 1, 2015
1.519K
-20.0
-1.3%
Ranking of countries by current statistics by years