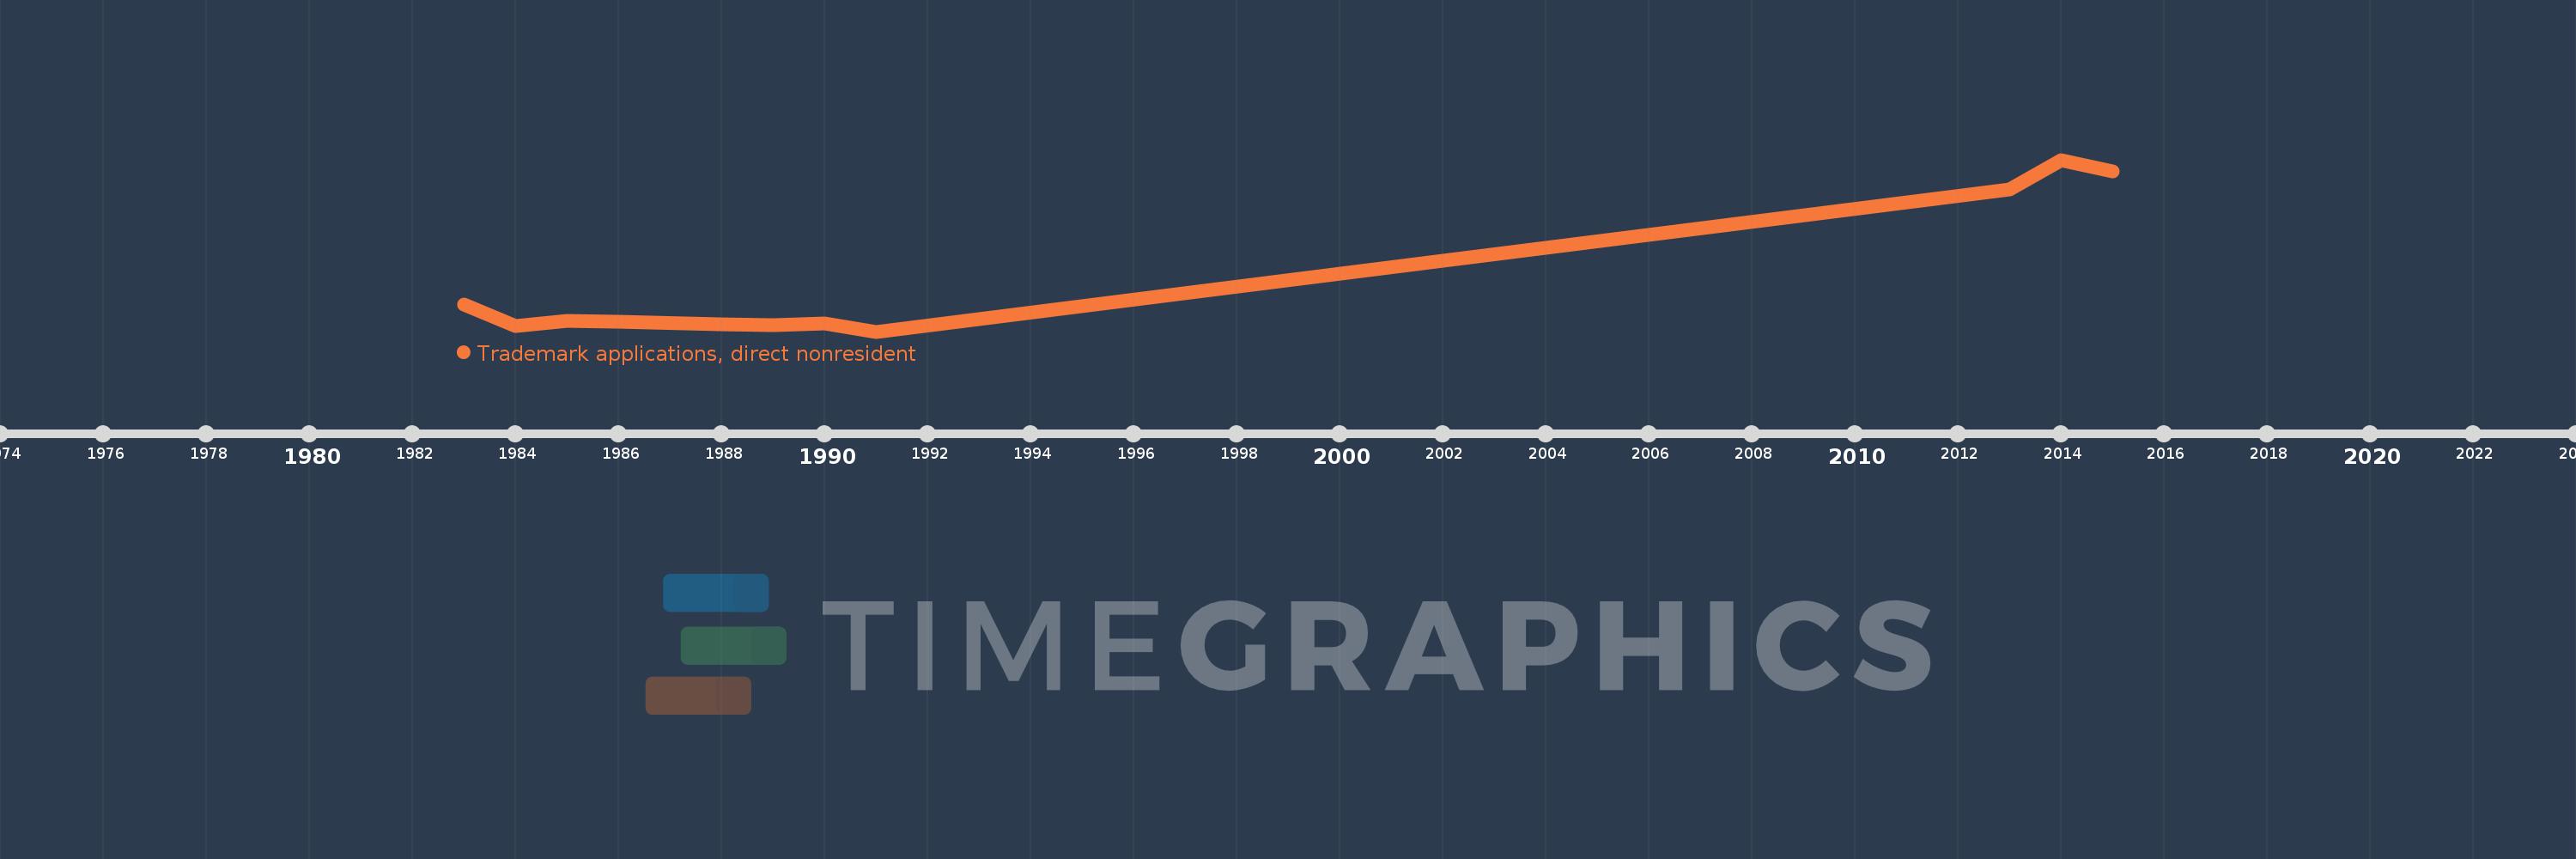
This timeline shows a graph from 1983 to 2015 of Guyana. No data until 1982. Number of actual observations by date: 11.
Source name:
World Development Indicators
Source organization:
World Intellectual Property Organization (WIPO), WIPO Patent Report: Statistics on Worldwide Patent Activity. The International Bureau of WIPO assumes no responsibility with respect to the transformation of these data.
Categories, topics:
Science & Technology
Last updated:
apr 23, 2017
Indicators value changes by year
Meaning:
315.909
Minimum:
129.0
jan 1, 1991
Maximum:
772.0
jan 1, 2014
At the date of observation
Value
Absolute change
Change from the previous value
jan 1, 1983
231.0
+231.0
0.0%
jan 1, 1984
151.0
-80.0
-34.63%
jan 1, 1985
169.0
+18.0
11.92%
jan 1, 1986
166.0
-3.0
-1.78%
jan 1, 1988
155.0
-11.0
-6.63%
jan 1, 1989
152.0
-3.0
-1.94%
jan 1, 1990
160.0
+8.0
5.26%
jan 1, 1991
129.0
-31.0
-19.37%
jan 1, 2013
662.0
+533.0
413.18%
jan 1, 2014
772.0
+110.0
16.62%
jan 1, 2015
728.0
-44.0
-5.7%
Ranking of countries by current statistics by years