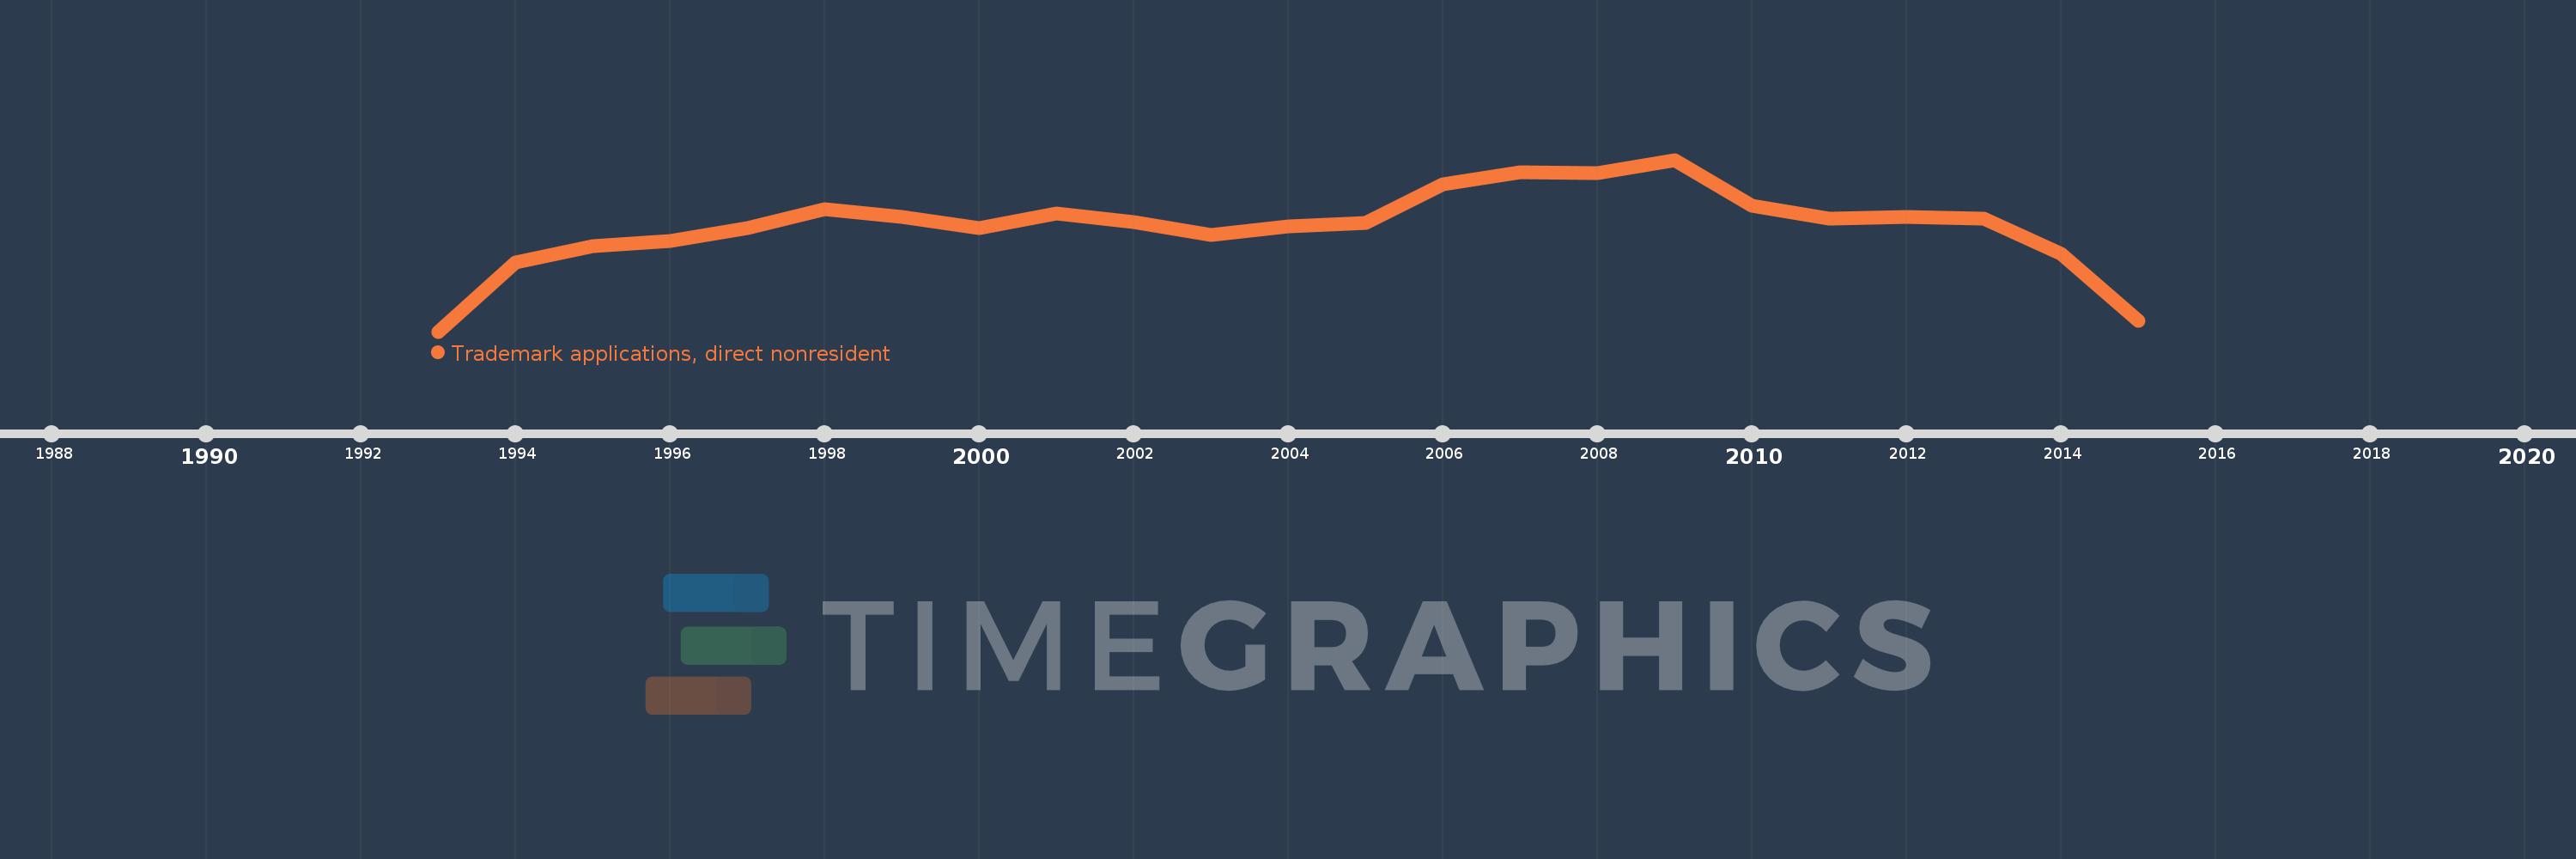
This timeline shows a graph from 1993 to 2015 of Croatia. No data until 1992. Number of actual observations by date: 23.
Source name:
World Development Indicators
Source organization:
World Intellectual Property Organization (WIPO), WIPO Patent Report: Statistics on Worldwide Patent Activity. The International Bureau of WIPO assumes no responsibility with respect to the transformation of these data.
Categories, topics:
Science & Technology
Last updated:
apr 23, 2017
Indicators value changes by year
Meaning:
5.927K
Minimum:
1.828K
jan 1, 1993
Maximum:
8.521K
jan 1, 2009
At the date of observation
Value
Absolute change
Change from the previous value
jan 1, 1993
1.828K
+1.828K
0.0%
jan 1, 1994
4.529K
+2.701K
147.76%
jan 1, 1995
5.169K
+640.0
14.13%
jan 1, 1996
5.362K
+193.0
3.73%
jan 1, 1997
5.849K
+487.0
9.08%
jan 1, 1998
6.582K
+733.0
12.53%
jan 1, 1999
6.308K
-274.0
-4.16%
jan 1, 2000
5.859K
-449.0
-7.12%
jan 1, 2001
6.417K
+558.0
9.52%
jan 1, 2002
6.111K
-306.0
-4.77%
jan 1, 2003
5.6K
-511.0
-8.36%
jan 1, 2004
5.921K
+321.0
5.73%
jan 1, 2005
6.072K
+151.0
2.55%
jan 1, 2006
7.559K
+1.487K
24.49%
jan 1, 2007
8.024K
+465.0
6.15%
jan 1, 2008
8.018K
-6.0
-0.07%
jan 1, 2009
8.521K
+503.0
6.27%
jan 1, 2010
6.724K
-1.797K
-21.09%
jan 1, 2011
6.225K
-499.0
-7.42%
jan 1, 2012
6.298K
+73.0
1.17%
jan 1, 2013
6.236K
-62.0
-0.98%
jan 1, 2014
4.865K
-1.371K
-21.99%
jan 1, 2015
2.243K
-2.622K
-53.9%
Ranking of countries by current statistics by years