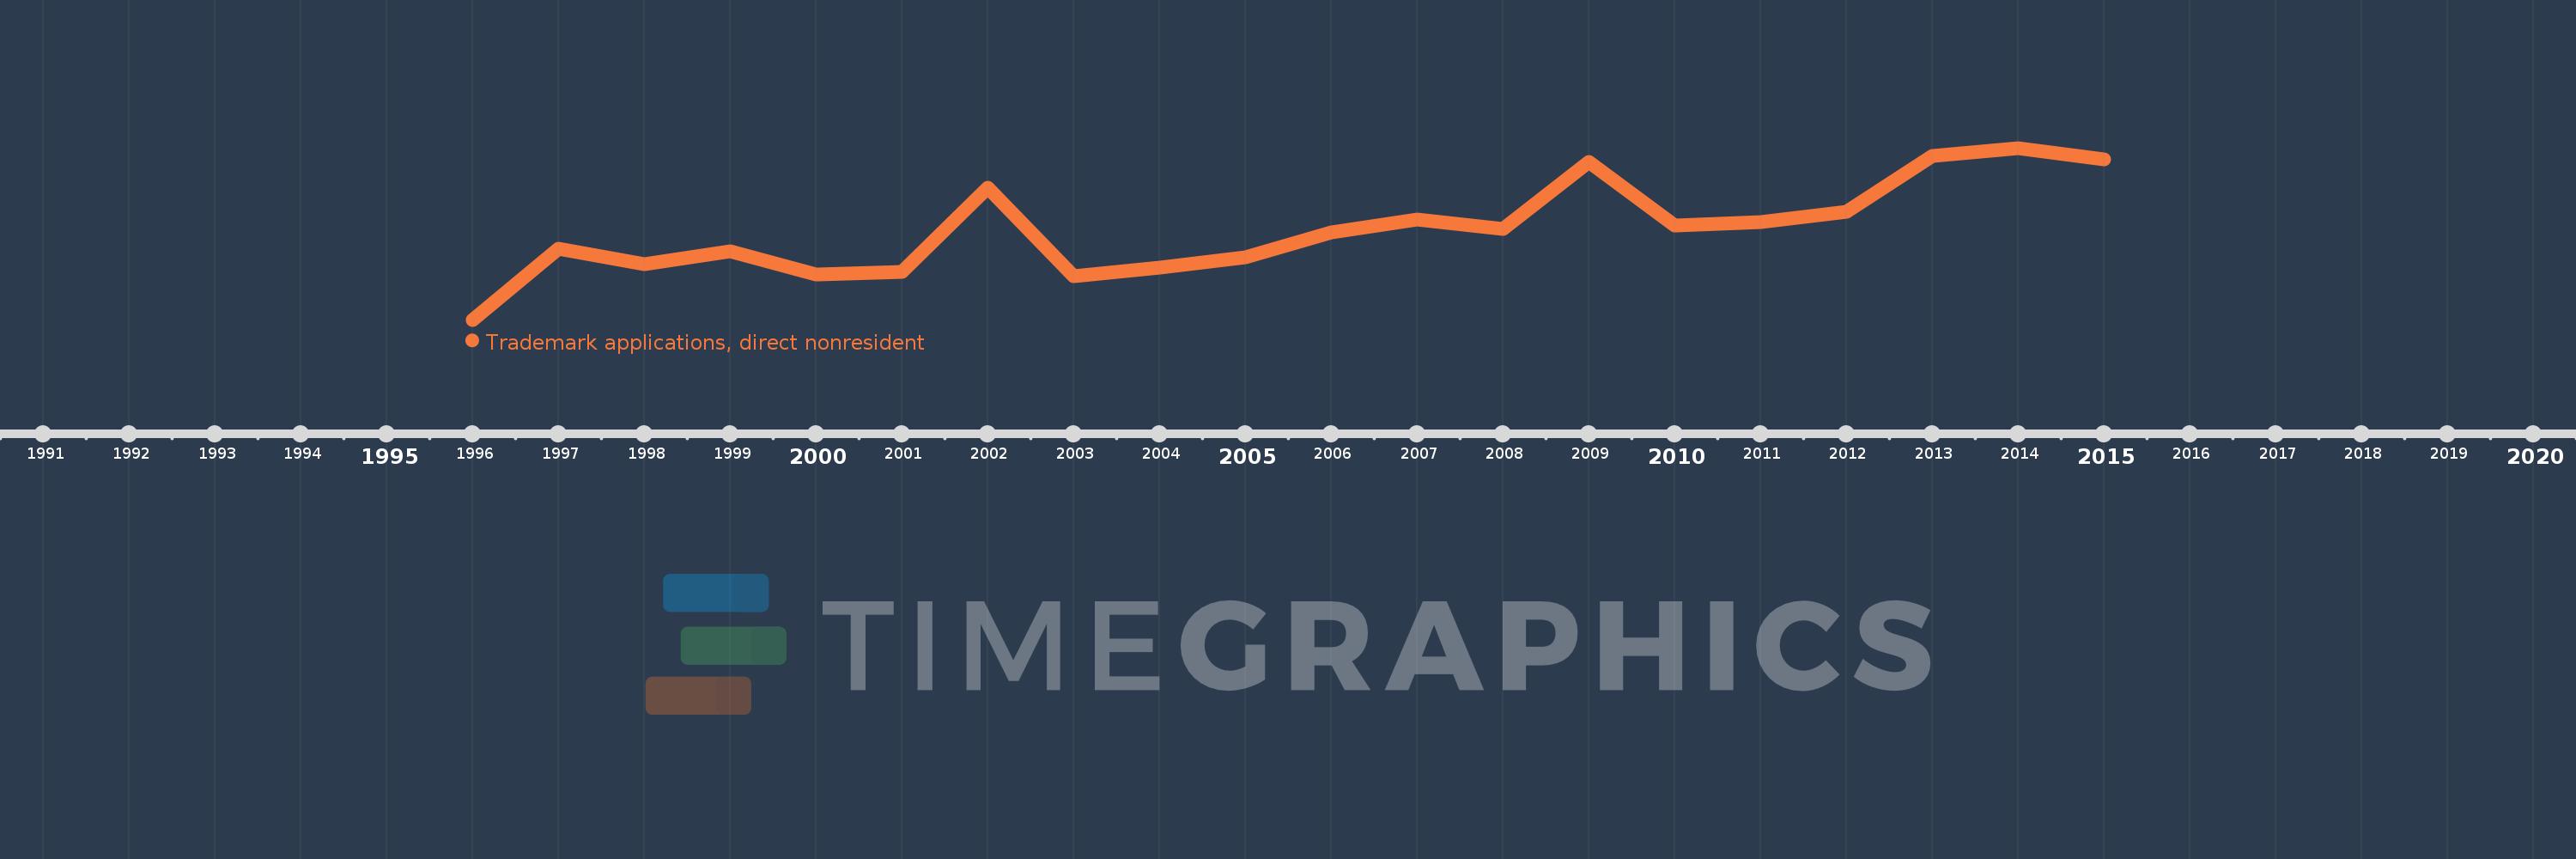
This timeline shows a graph from 1996 to 2015 of Azerbaijan. No data until 1995. Number of actual observations by date: 20.
Source name:
World Development Indicators
Source organization:
World Intellectual Property Organization (WIPO), WIPO Patent Report: Statistics on Worldwide Patent Activity. The International Bureau of WIPO assumes no responsibility with respect to the transformation of these data.
Categories, topics:
Science & Technology
Last updated:
apr 23, 2017
Indicators value changes by year
Meaning:
3.141K
Minimum:
1.035K
jan 1, 1996
Maximum:
5.033K
jan 1, 2014
At the date of observation
Value
Absolute change
Change from the previous value
jan 1, 1996
1.035K
+1.035K
0.0%
jan 1, 1997
2.685K
+1.65K
159.42%
jan 1, 1998
2.333K
-352.0
-13.11%
jan 1, 1999
2.628K
+295.0
12.64%
jan 1, 2000
2.094K
-534.0
-20.32%
jan 1, 2001
2.144K
+50.0
2.39%
jan 1, 2002
4.112K
+1.968K
91.79%
jan 1, 2003
2.051K
-2.061K
-50.12%
jan 1, 2004
2.246K
+195.0
9.51%
jan 1, 2005
2.482K
+236.0
10.51%
jan 1, 2006
3.061K
+579.0
23.33%
jan 1, 2007
3.363K
+302.0
9.87%
jan 1, 2008
3.149K
-214.0
-6.36%
jan 1, 2009
4.701K
+1.552K
49.29%
jan 1, 2010
3.221K
-1.48K
-31.48%
jan 1, 2011
3.31K
+89.0
2.76%
jan 1, 2012
3.555K
+245.0
7.4%
jan 1, 2013
4.845K
+1.29K
36.29%
jan 1, 2014
5.033K
+188.0
3.88%
jan 1, 2015
4.765K
-268.0
-5.32%
Ranking of countries by current statistics by years