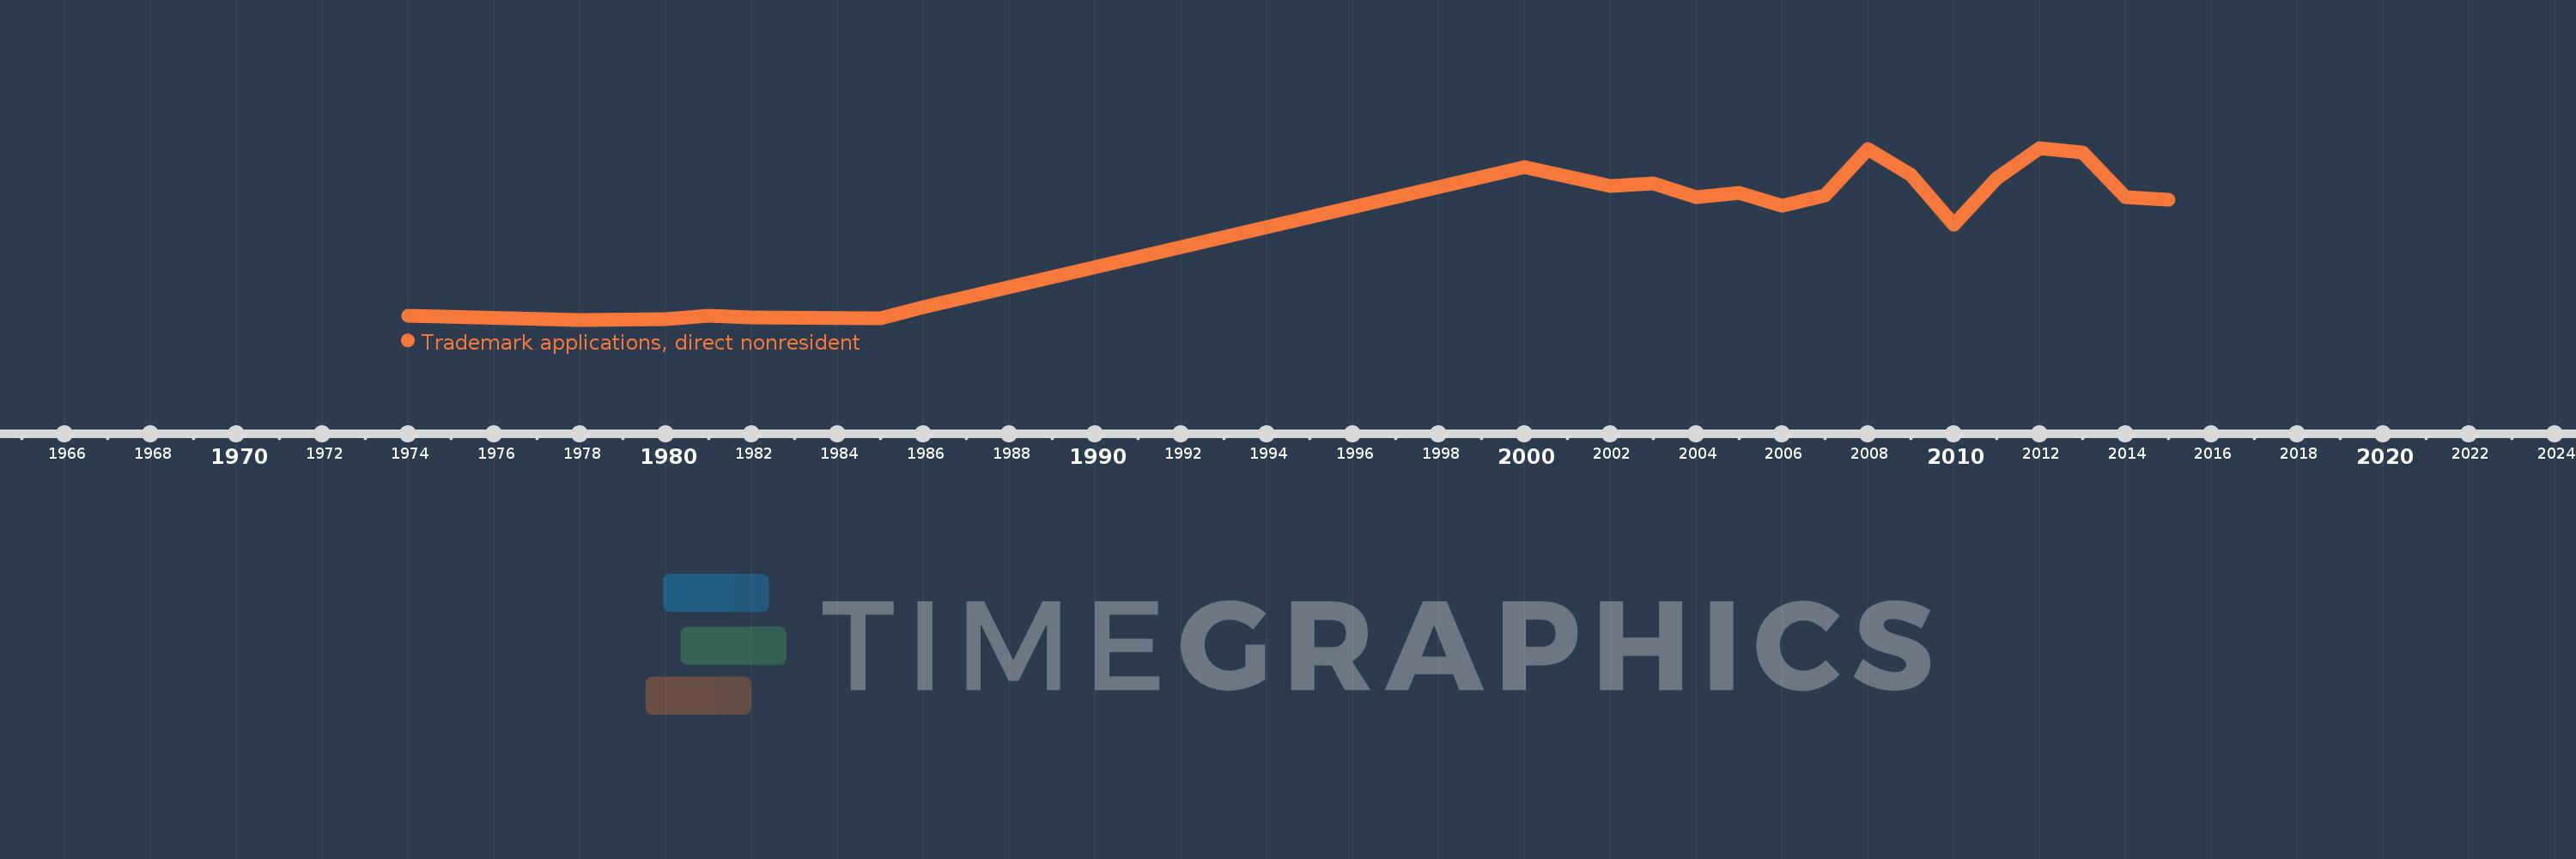
This timeline shows a graph from 1974 to 2015 of Barbados. No data until 1973. Number of actual observations by date: 22.
Source name:
World Development Indicators
Source organization:
World Intellectual Property Organization (WIPO), WIPO Patent Report: Statistics on Worldwide Patent Activity. The International Bureau of WIPO assumes no responsibility with respect to the transformation of these data.
Categories, topics:
Science & Technology
Last updated:
apr 23, 2017
Indicators value changes by year
Meaning:
800.909
Minimum:
284.0
jan 1, 1978
Maximum:
1.229K
jan 1, 2012
At the date of observation
Value
Absolute change
Change from the previous value
jan 1, 1974
304.0
+304.0
0.0%
jan 1, 1978
284.0
-20.0
-6.58%
jan 1, 1980
289.0
+5.0
1.76%
jan 1, 1981
304.0
+15.0
5.19%
jan 1, 1982
298.0
-6.0
-1.97%
jan 1, 1985
291.0
-7.0
-2.35%
jan 1, 1986
355.0
+64.0
21.99%
jan 1, 2000
1.123K
+768.0
216.34%
jan 1, 2002
1.02K
-103.0
-9.17%
jan 1, 2003
1.032K
+12.0
1.18%
jan 1, 2004
960.0
-72.0
-6.98%
jan 1, 2005
981.0
+21.0
2.19%
jan 1, 2006
909.0
-72.0
-7.34%
jan 1, 2007
966.0
+57.0
6.27%
jan 1, 2008
1.223K
+257.0
26.6%
jan 1, 2009
1.079K
-144.0
-11.77%
jan 1, 2010
808.0
-271.0
-25.12%
jan 1, 2011
1.061K
+253.0
31.31%
jan 1, 2012
1.229K
+168.0
15.83%
jan 1, 2013
1.202K
-27.0
-2.2%
jan 1, 2014
958.0
-244.0
-20.3%
jan 1, 2015
944.0
-14.0
-1.46%
Ranking of countries by current statistics by years