30
/
AIzaSyAYiBZKx7MnpbEhh9jyipgxe19OcubqV5w
April 1, 2024
221665
Paraguay
PRY
true
2
1
Trademark applications, direct nonresident
2011,2010,2009,2008,2007,2006,2005,2004,2003,2002,2001,1994,1993,1990,1986,1985,1984,1983,1982
Download
Global statistics library →Paraguay →

Trademark applications, direct nonresident

This statistics in other country:

AlbaniaAlgeriaAndorraAngolaAntigua and BarbudaArab WorldArgentinaArmeniaArubaAustraliaAustriaAzerbaijanBahamas, TheBahrainBangladeshBarbadosBelarusBelgiumBelizeBhutanBoliviaBosnia and HerzegovinaBotswanaBrazilBrunei DarussalamBulgariaBurundiCambodiaCanadaCaribbean small statesCentral Europe and the BalticsChileChinaColombiaCongo, Dem. Rep.Costa RicaCroatiaCubaCuracaoCyprusCzech RepublicDenmarkDjiboutiDominicaDominican RepublicEarly-demographic dividendEast Asia & PacificEast Asia & Pacific (excluding high income)East Asia & Pacific (IDA & IBRD countries)EcuadorEgypt, Arab Rep.El SalvadorEstoniaEthiopiaEuro areaEurope & Central AsiaEurope & Central Asia (excluding high income)Europe & Central Asia (IDA & IBRD countries)European UnionFijiFinlandFranceGambia, TheGeorgiaGermanyGhanaGreeceGrenadaGuatemalaGuyanaHaitiHigh incomeHondurasHong Kong SAR, ChinaHungaryIBRD onlyIcelandIDA & IBRD totalIDA blendIndiaIndonesiaIran, Islamic Rep.IraqIrelandIsraelItalyJamaicaJapanJordanKazakhstanKenyaKiribatiKorea, Dem. People’s Rep.Korea, Rep.KuwaitKyrgyz RepublicLao PDRLate-demographic dividendLatin America & Caribbean Latin America & Caribbean (excluding high income)Latin America & the Caribbean (IDA & IBRD countries)LatviaLebanonLesothoLiberiaLibyaLiechtensteinLithuaniaLow & middle incomeLower middle incomeLuxembourgMacao SAR, ChinaMacedonia, FYRMadagascarMalawiMalaysiaMaliMaltaMauritiusMexicoMiddle East & North AfricaMiddle East & North Africa (excluding high income)Middle East & North Africa (IDA & IBRD countries)Middle incomeMoldovaMonacoMongoliaMontenegroMoroccoMozambiqueMyanmarNamibiaNepalNetherlandsNew ZealandNicaraguaNigeriaNorth AmericaNorwayOECD membersOmanOther small statesPacific island small statesPakistanPanamaPapua New GuineaParaguayPeruPhilippinesPolandPortugalPost-demographic dividendQatarRomaniaRussian FederationRwandaSamoaSan MarinoSao Tome and PrincipeSaudi ArabiaSerbiaSeychellesSierra LeoneSingaporeSint Maarten (Dutch part)Slovak RepublicSloveniaSmall statesSolomon IslandsSomaliaSouth AfricaSouth AsiaSouth Asia (IDA & IBRD)SpainSri LankaSt. LuciaSt. Vincent and the GrenadinesSudanSurinameSwazilandSwedenSwitzerlandSyrian Arab RepublicTajikistanTanzaniaThailandTongaTrinidad and TobagoTunisiaTurkeyTurkmenistanTuvaluUgandaUkraineUnited Arab EmiratesUnited KingdomUnited StatesUpper middle incomeUruguayUzbekistanVenezuela, RBVietnamWorldYemen, Rep.ZambiaZimbabwe

Timeline:

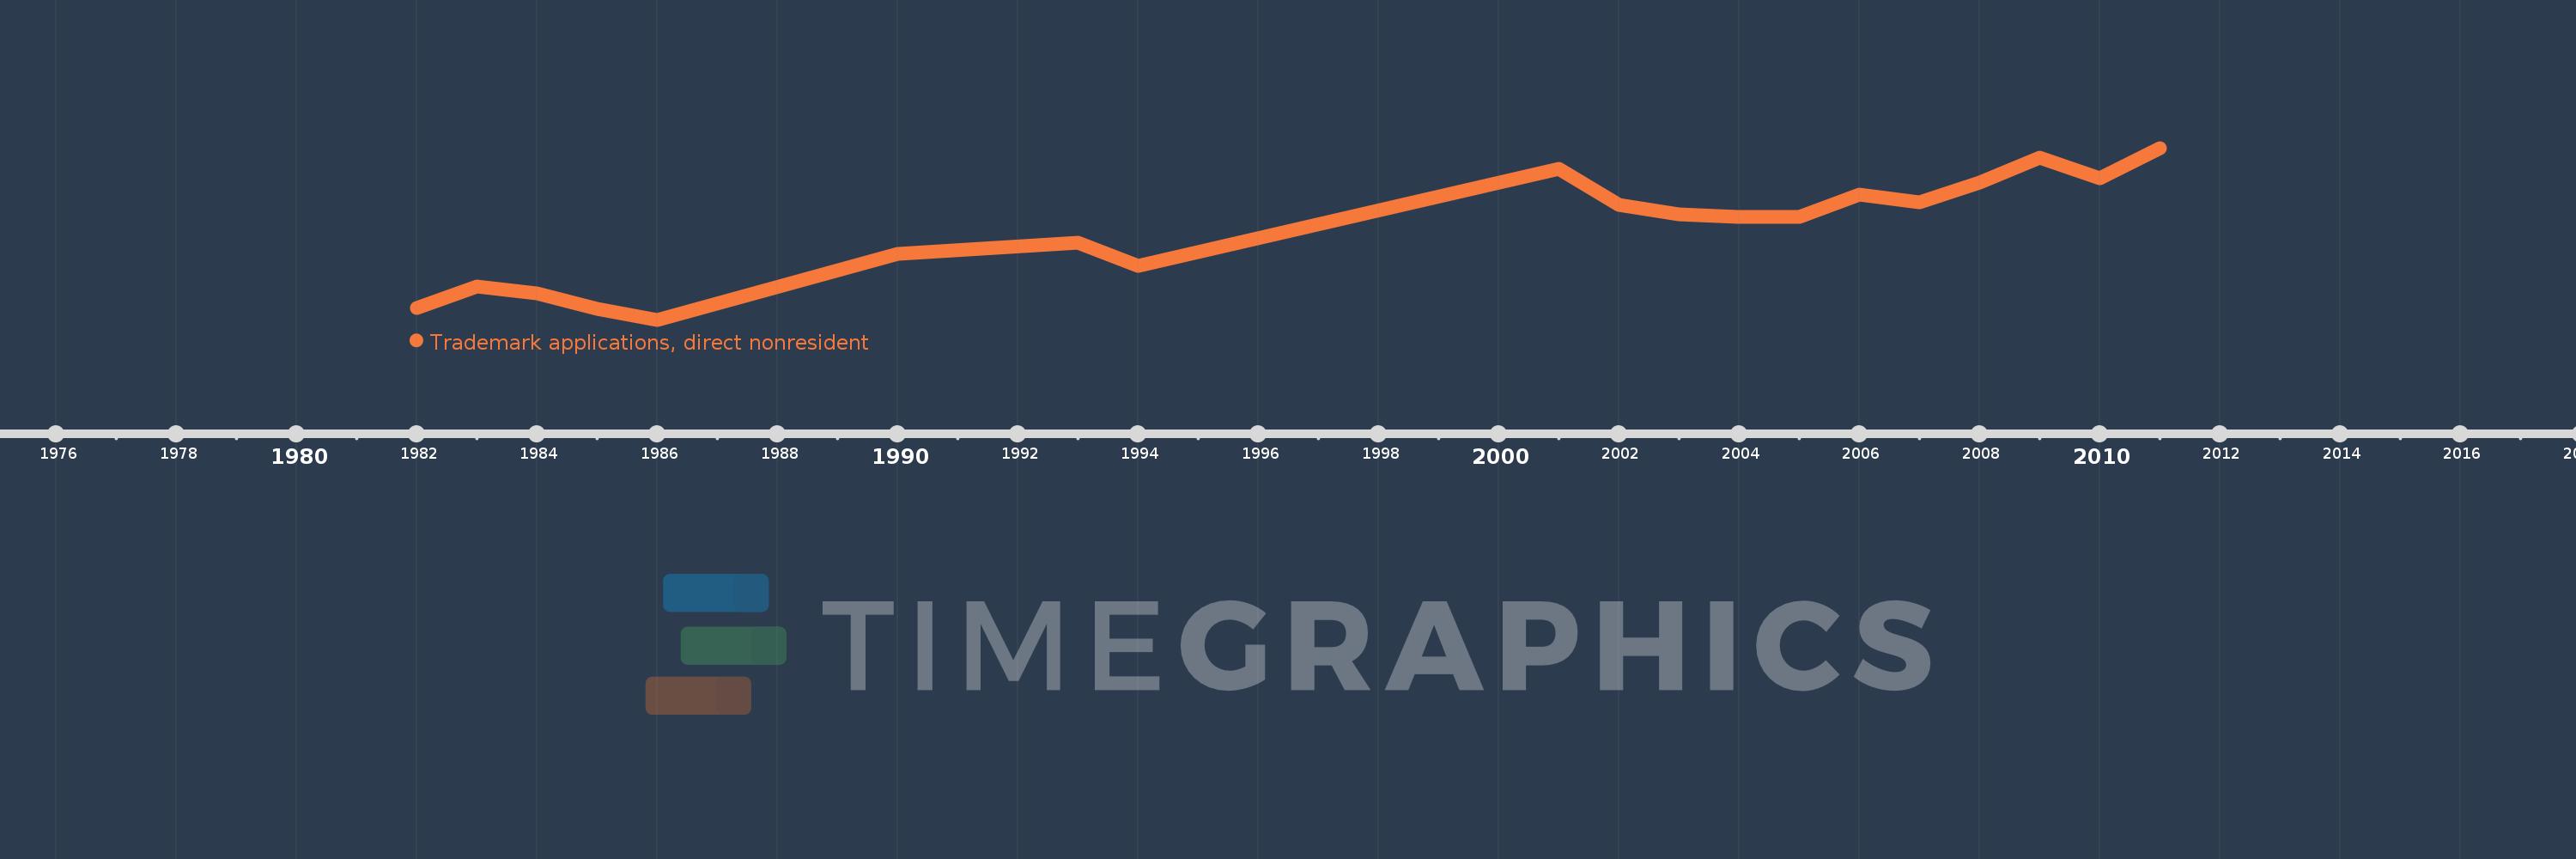
This timeline shows a graph from 1982 to 2011 of Paraguay. No data until 1981. Number of actual observations by date: 19.

Source name:

World Development Indicators

Source organization:

World Intellectual Property Organization (WIPO), WIPO Patent Report: Statistics on Worldwide Patent Activity. The International Bureau of WIPO assumes no responsibility with respect to the transformation of these data.

Categories, topics:

Science & Technology

Last updated:

apr 23, 2017

Indicators value changes by year

Meaning:
5.144K
Minimum:
937.0
jan 1, 1986
Maximum:
8.962K
jan 1, 2011
At the date of observation
Value
Absolute change
Change from the previous value
jan 1, 1982
1.492K
+1.492K
0.0%
jan 1, 1983
2.507K
+1.015K
68.03%
jan 1, 1984
2.154K
-353.0
-14.08%
jan 1, 1985
1.429K
-725.0
-33.66%
jan 1, 1986
937.0
-492.0
-34.43%
jan 1, 1990
4.006K
+3.069K
327.53%
jan 1, 1993
4.55K
+544.0
13.58%
jan 1, 1994
3.461K
-1.089K
-23.93%
jan 1, 2001
8.004K
+4.543K
131.26%
jan 1, 2002
6.297K
-1.707K
-21.33%
jan 1, 2003
5.858K
-439.0
-6.97%
jan 1, 2004
5.743K
-115.0
-1.96%
jan 1, 2005
5.749K
+6.0
0.1%
jan 1, 2006
6.774K
+1.025K
17.83%
jan 1, 2007
6.426K
-348.0
-5.14%
jan 1, 2008
7.356K
+930.0
14.47%
jan 1, 2009
8.506K
+1.15K
15.63%
jan 1, 2010
7.531K
-975.0
-11.46%
jan 1, 2011
8.962K
+1.431K
19.0%

Ranking of countries by current statistics by years