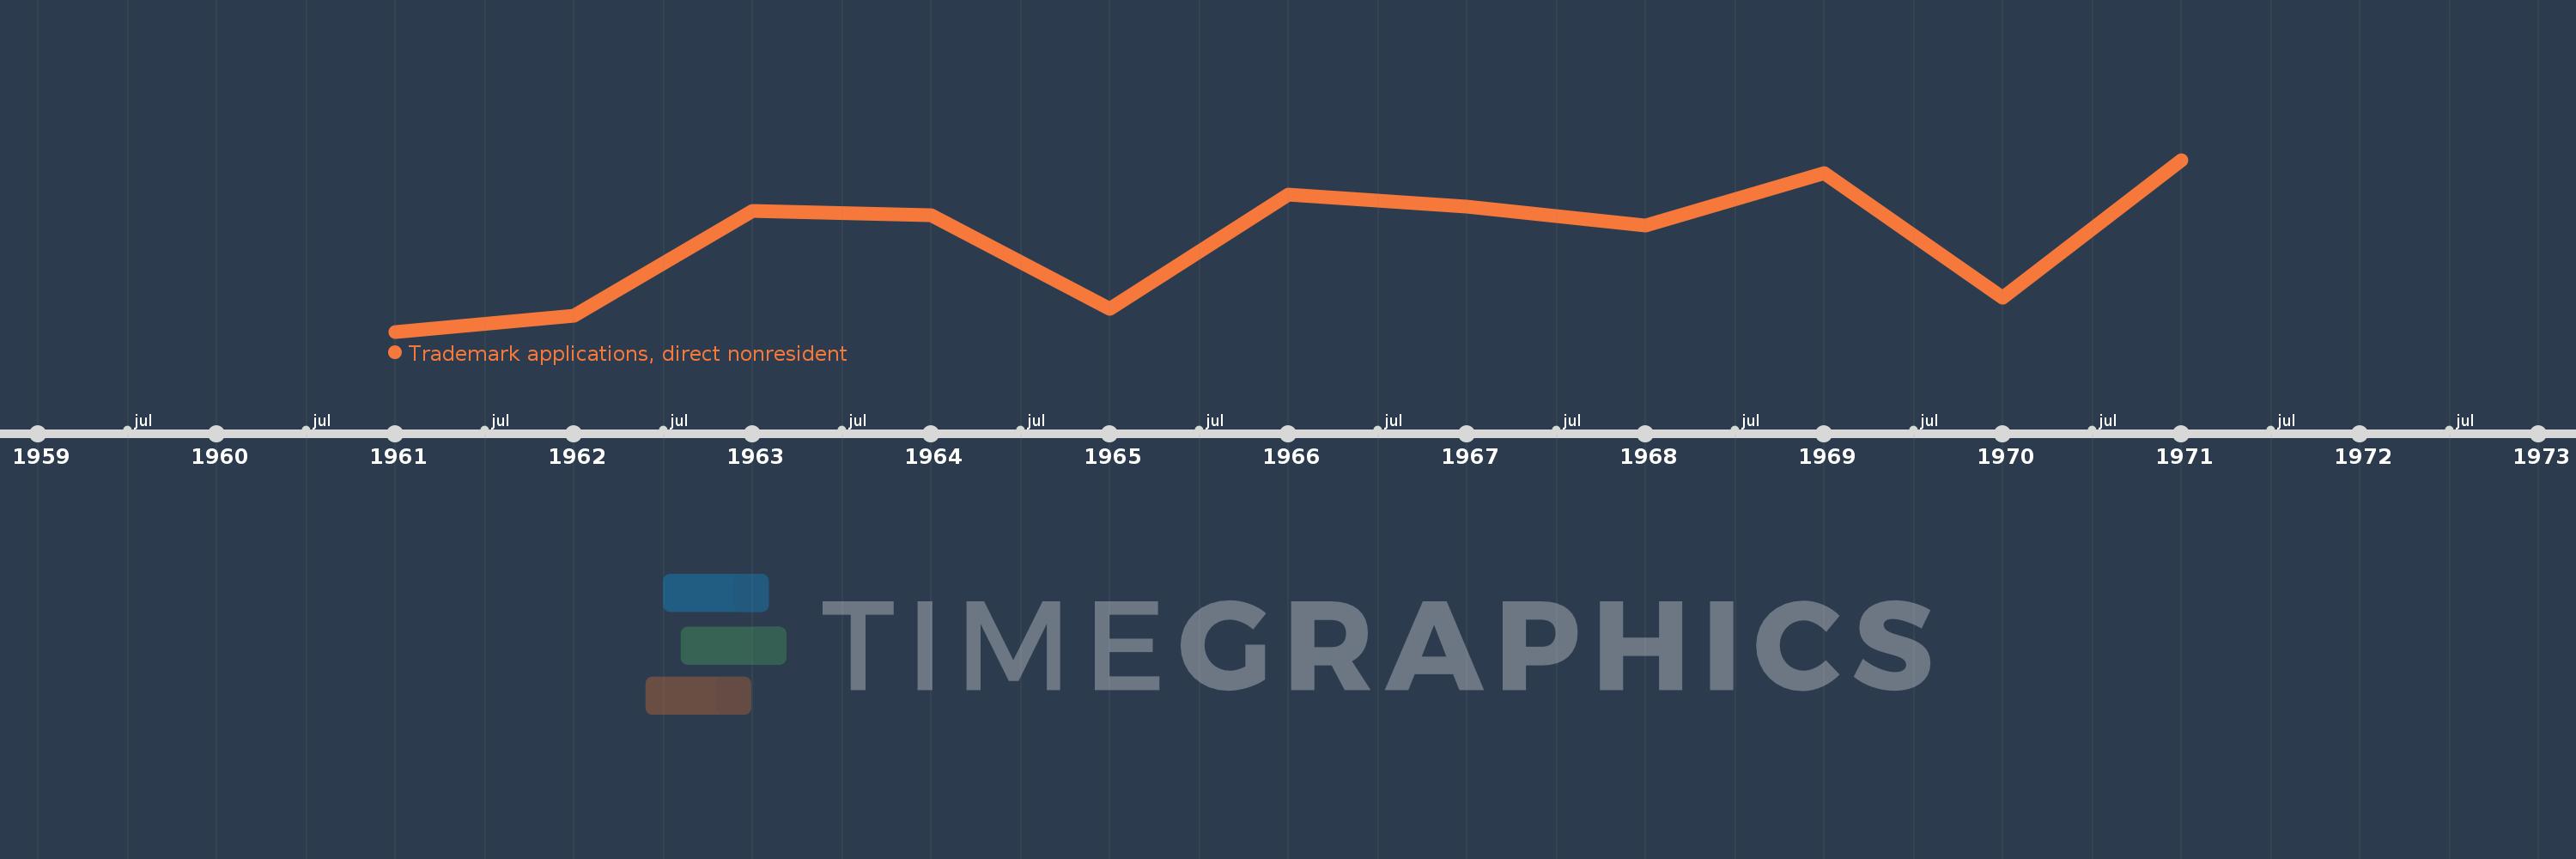
This timeline shows a graph from 1961 to 1971 of Luxembourg. No data until 1960. Number of actual observations by date: 11.
Source name:
World Development Indicators
Source organization:
World Intellectual Property Organization (WIPO), WIPO Patent Report: Statistics on Worldwide Patent Activity. The International Bureau of WIPO assumes no responsibility with respect to the transformation of these data.
Categories, topics:
Science & Technology
Last updated:
apr 23, 2017
Indicators value changes by year
Meaning:
946.636
Minimum:
653.0
jan 1, 1961
Maximum:
1.204K
jan 1, 1971
At the date of observation
Value
Absolute change
Change from the previous value
jan 1, 1961
653.0
+653.0
0.0%
jan 1, 1962
704.0
+51.0
7.81%
jan 1, 1963
1.04K
+336.0
47.73%
jan 1, 1964
1.025K
-15.0
-1.44%
jan 1, 1965
727.0
-298.0
-29.07%
jan 1, 1966
1.092K
+365.0
50.21%
jan 1, 1967
1.055K
-37.0
-3.39%
jan 1, 1968
992.0
-63.0
-5.97%
jan 1, 1969
1.16K
+168.0
16.94%
jan 1, 1970
761.0
-399.0
-34.4%
jan 1, 1971
1.204K
+443.0
58.21%
Ranking of countries by current statistics by years