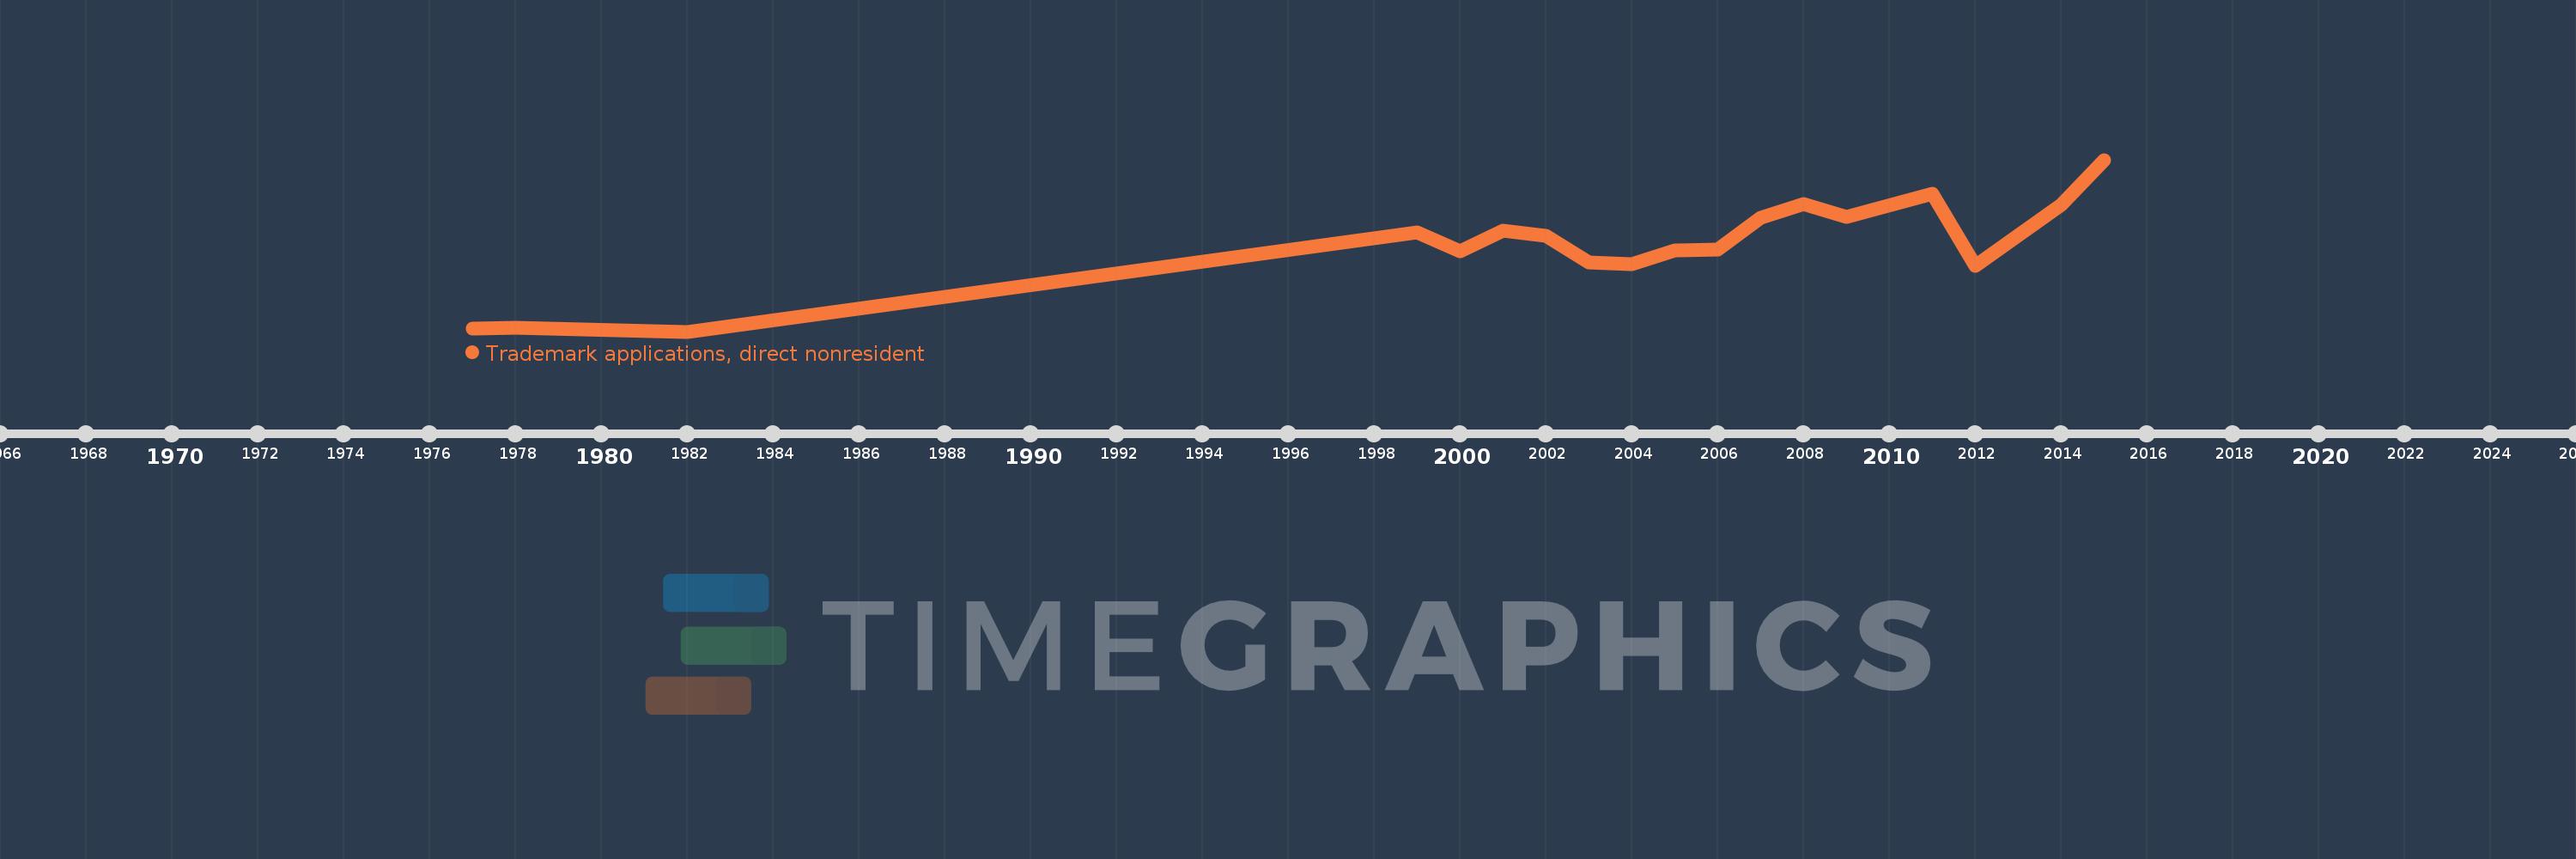
This timeline shows a graph from 1977 to 2015 of Yemen, Rep.. No data until 1976. Number of actual observations by date: 18.
Source name:
World Development Indicators
Source organization:
World Intellectual Property Organization (WIPO), WIPO Patent Report: Statistics on Worldwide Patent Activity. The International Bureau of WIPO assumes no responsibility with respect to the transformation of these data.
Categories, topics:
Science & Technology
Last updated:
apr 23, 2017
Indicators value changes by year
Meaning:
1.329K
Minimum:
92.0
jan 1, 1982
Maximum:
2.575K
jan 1, 2015
At the date of observation
Value
Absolute change
Change from the previous value
jan 1, 1977
141.0
+141.0
0.0%
jan 1, 1978
145.0
+4.0
2.84%
jan 1, 1982
92.0
-53.0
-36.55%
jan 1, 1999
1.532K
+1.44K
1.57K%
jan 1, 2000
1.247K
-285.0
-18.6%
jan 1, 2001
1.556K
+309.0
24.78%
jan 1, 2002
1.474K
-82.0
-5.27%
jan 1, 2003
1.092K
-382.0
-25.92%
jan 1, 2004
1.063K
-29.0
-2.66%
jan 1, 2005
1.261K
+198.0
18.63%
jan 1, 2006
1.278K
+17.0
1.35%
jan 1, 2007
1.737K
+459.0
35.92%
jan 1, 2008
1.934K
+197.0
11.34%
jan 1, 2009
1.746K
-188.0
-9.72%
jan 1, 2011
2.085K
+339.0
19.42%
jan 1, 2012
1.042K
-1.043K
-50.02%
jan 1, 2014
1.921K
+879.0
84.36%
jan 1, 2015
2.575K
+654.0
34.04%
Ranking of countries by current statistics by years