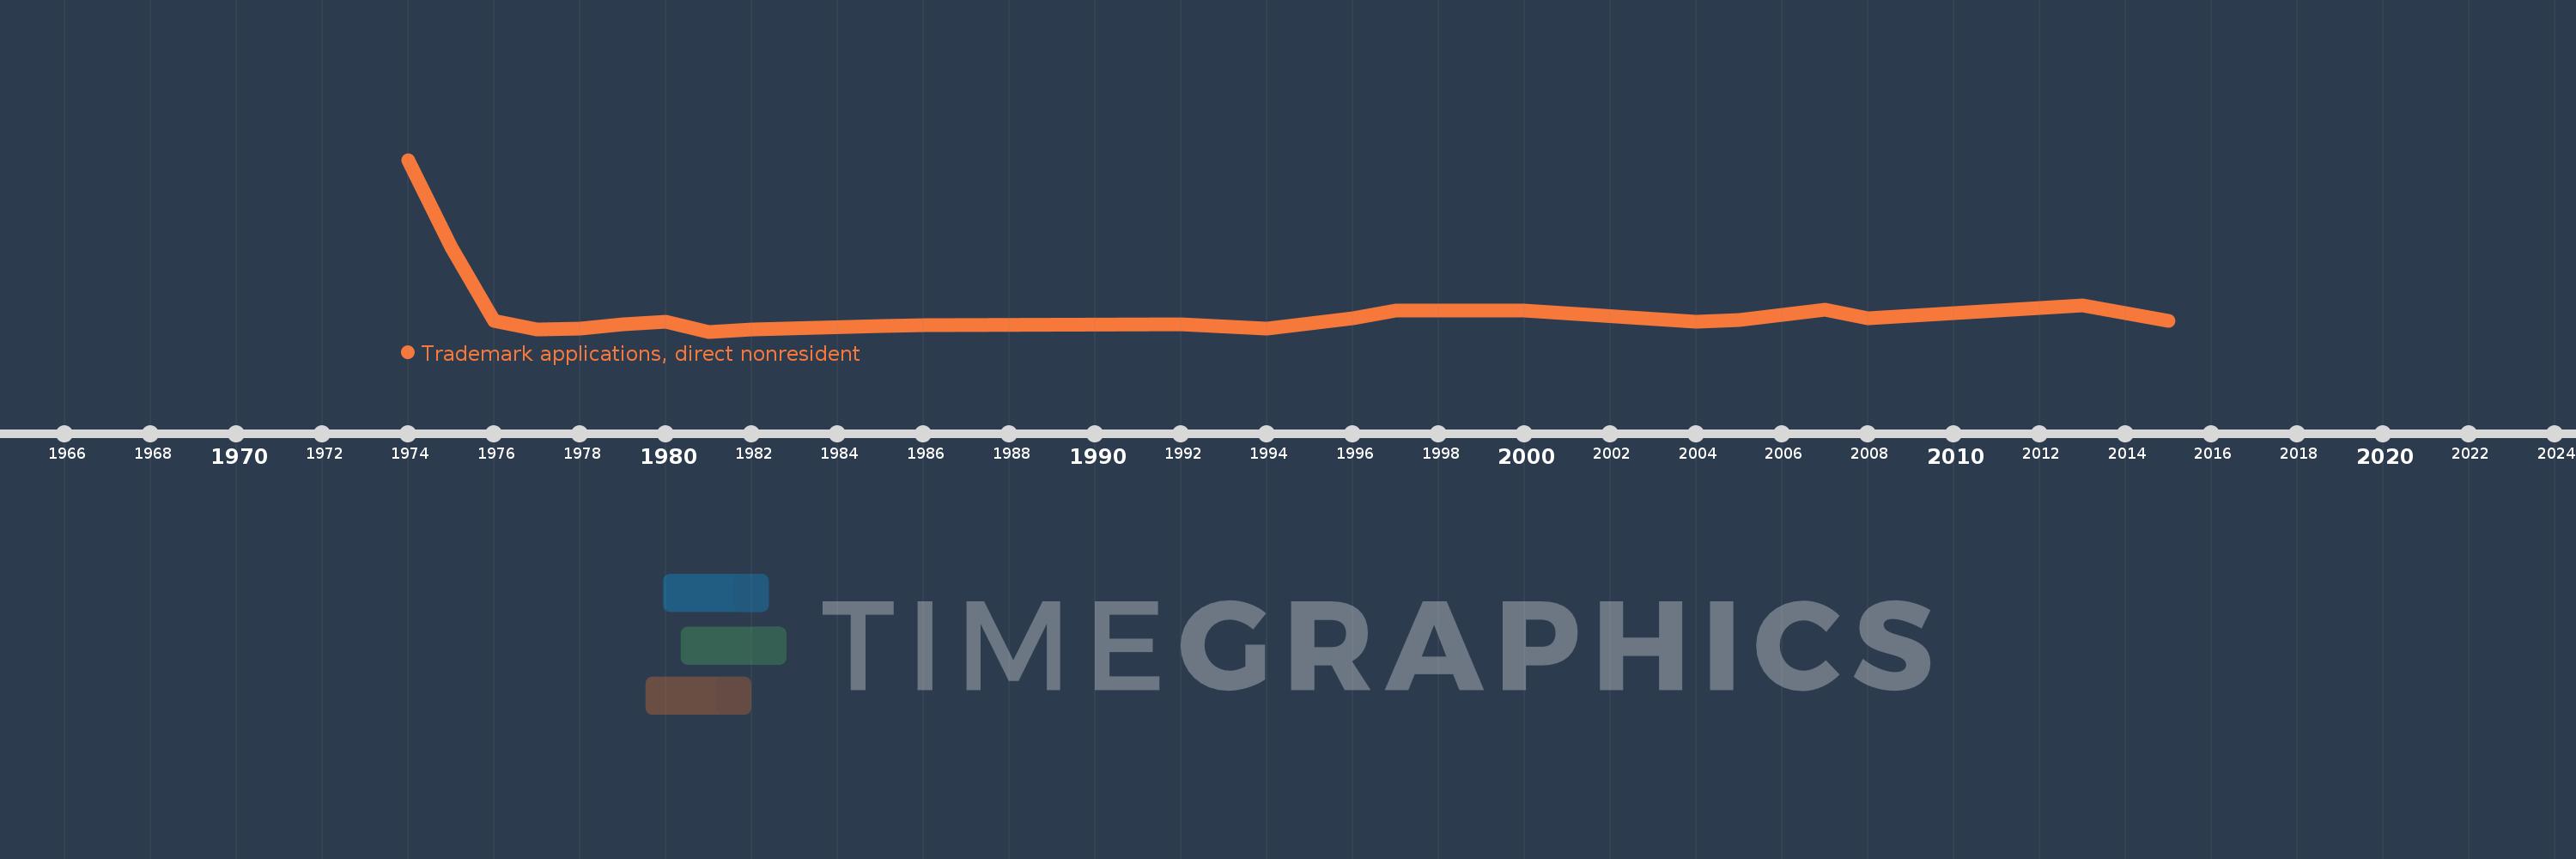
This timeline shows a graph from 1974 to 2015 of Samoa. No data until 1973. Number of actual observations by date: 22.
Source name:
World Development Indicators
Source organization:
World Intellectual Property Organization (WIPO), WIPO Patent Report: Statistics on Worldwide Patent Activity. The International Bureau of WIPO assumes no responsibility with respect to the transformation of these data.
Categories, topics:
Science & Technology
Last updated:
apr 23, 2017
Indicators value changes by year
Meaning:
176.409
Minimum:
55.0
jan 1, 1981
Maximum:
1.05K
jan 1, 1974
At the date of observation
Value
Absolute change
Change from the previous value
jan 1, 1974
1.05K
+1.05K
0.0%
jan 1, 1975
545.0
-505.0
-48.1%
jan 1, 1976
116.0
-429.0
-78.72%
jan 1, 1977
68.0
-48.0
-41.38%
jan 1, 1978
72.0
+4.0
5.88%
jan 1, 1979
97.0
+25.0
34.72%
jan 1, 1980
110.0
+13.0
13.4%
jan 1, 1981
55.0
-55.0
-50.0%
jan 1, 1982
66.0
+11.0
20.0%
jan 1, 1985
85.0
+19.0
28.79%
jan 1, 1986
90.0
+5.0
5.88%
jan 1, 1992
99.0
+9.0
10.0%
jan 1, 1994
73.0
-26.0
-26.26%
jan 1, 1996
132.0
+59.0
80.82%
jan 1, 1997
176.0
+44.0
33.33%
jan 1, 2000
175.0
-1.0
-0.57%
jan 1, 2004
113.0
-62.0
-35.43%
jan 1, 2005
122.0
+9.0
7.96%
jan 1, 2007
184.0
+62.0
50.82%
jan 1, 2008
130.0
-54.0
-29.35%
jan 1, 2013
205.0
+75.0
57.69%
jan 1, 2015
118.0
-87.0
-42.44%
Ranking of countries by current statistics by years