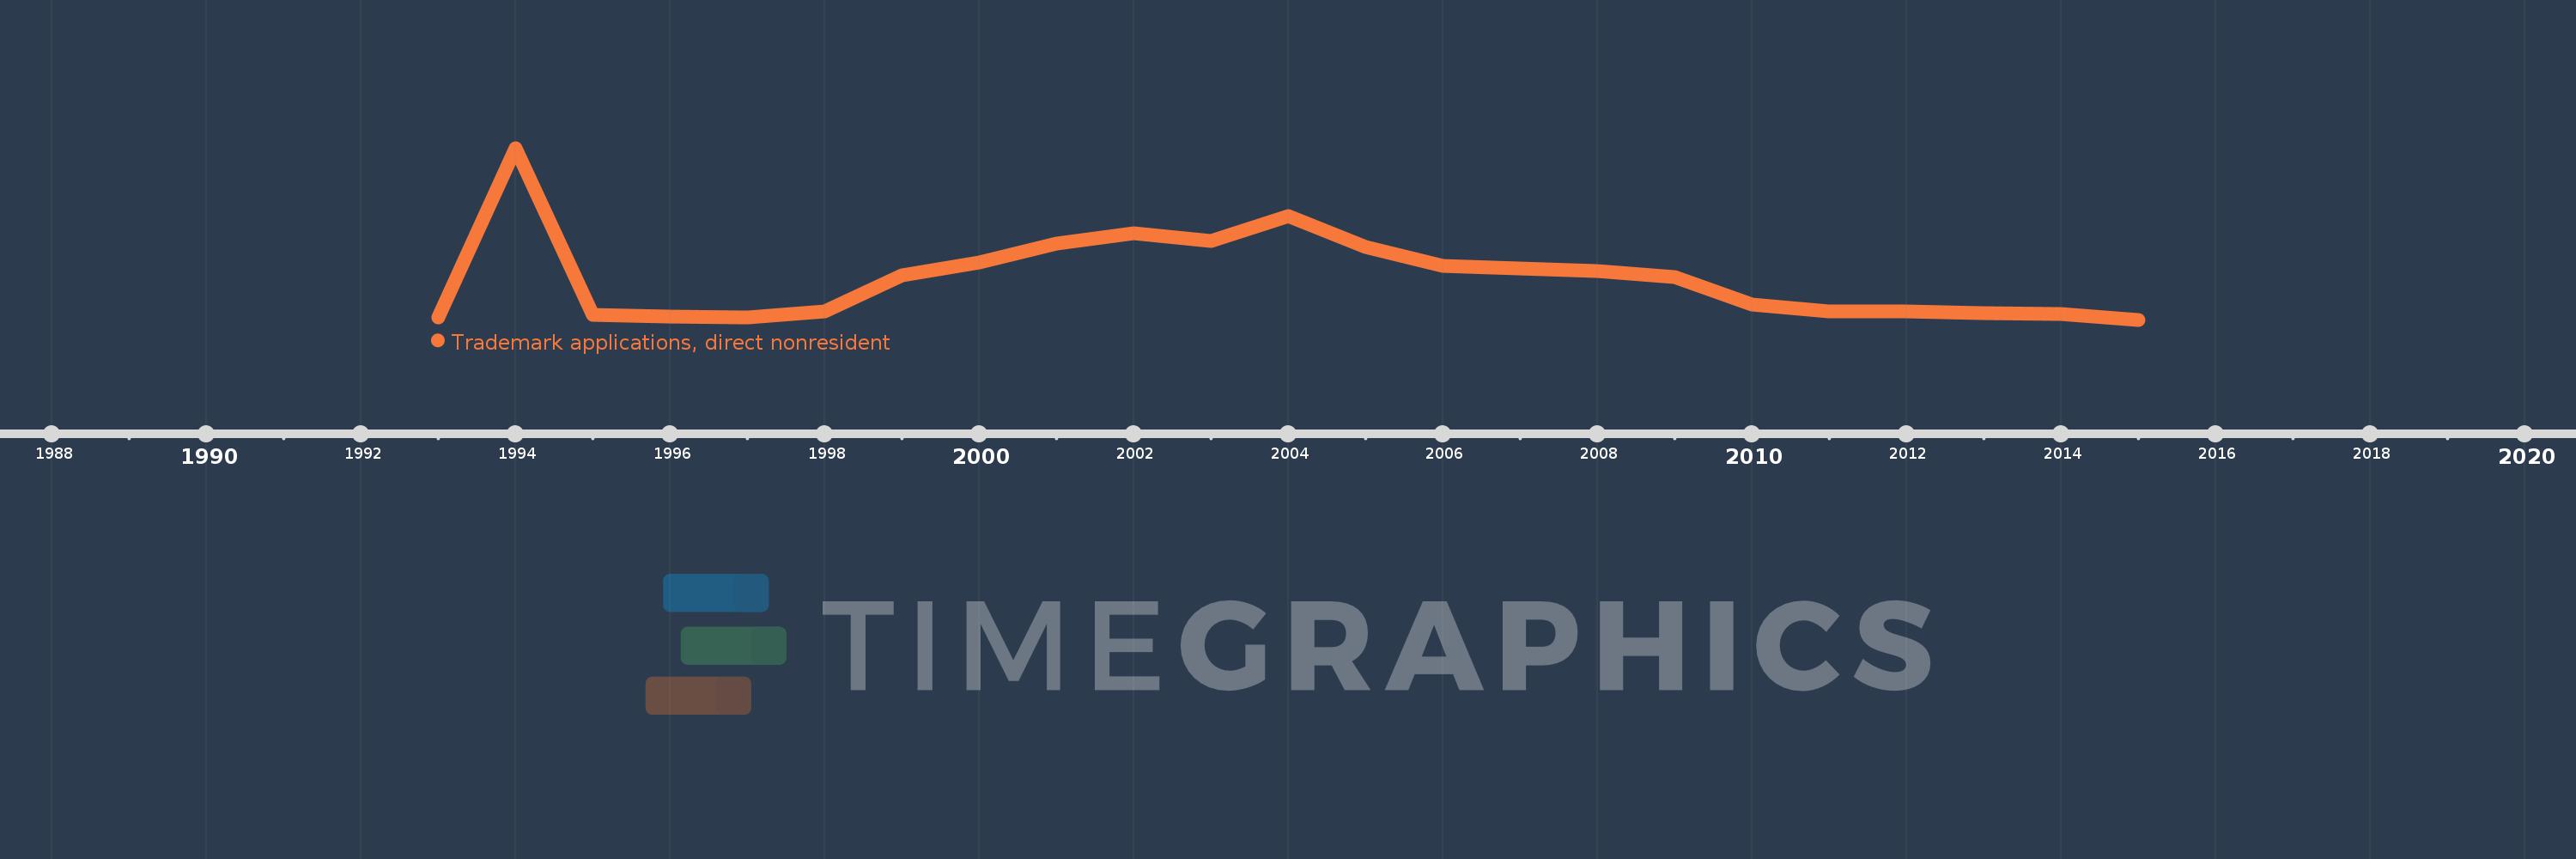
This timeline shows a graph from 1993 to 2015 of Lithuania. No data until 1992. Number of actual observations by date: 23.
Source name:
World Development Indicators
Source organization:
World Intellectual Property Organization (WIPO), WIPO Patent Report: Statistics on Worldwide Patent Activity. The International Bureau of WIPO assumes no responsibility with respect to the transformation of these data.
Categories, topics:
Science & Technology
Last updated:
apr 23, 2017
Indicators value changes by year
Meaning:
3.871K
Minimum:
1.925K
jan 1, 2015
Maximum:
9.986K
jan 1, 1994
At the date of observation
Value
Absolute change
Change from the previous value
jan 1, 1993
2.041K
+2.041K
0.0%
jan 1, 1994
9.986K
+7.945K
389.27%
jan 1, 1995
2.153K
-7.833K
-78.44%
jan 1, 1996
2.079K
-74.0
-3.44%
jan 1, 1997
2.045K
-34.0
-1.64%
jan 1, 1998
2.316K
+271.0
13.25%
jan 1, 1999
4.025K
+1.709K
73.79%
jan 1, 2000
4.612K
+587.0
14.58%
jan 1, 2001
5.5K
+888.0
19.25%
jan 1, 2002
5.994K
+494.0
8.98%
jan 1, 2003
5.602K
-392.0
-6.54%
jan 1, 2004
6.77K
+1.168K
20.85%
jan 1, 2005
5.32K
-1.45K
-21.42%
jan 1, 2006
4.463K
-857.0
-16.11%
jan 1, 2007
4.35K
-113.0
-2.53%
jan 1, 2008
4.222K
-128.0
-2.94%
jan 1, 2009
3.915K
-307.0
-7.27%
jan 1, 2010
2.632K
-1.283K
-32.77%
jan 1, 2011
2.311K
-321.0
-12.2%
jan 1, 2012
2.335K
+24.0
1.04%
jan 1, 2013
2.226K
-109.0
-4.67%
jan 1, 2014
2.207K
-19.0
-0.85%
jan 1, 2015
1.925K
-282.0
-12.78%
Ranking of countries by current statistics by years