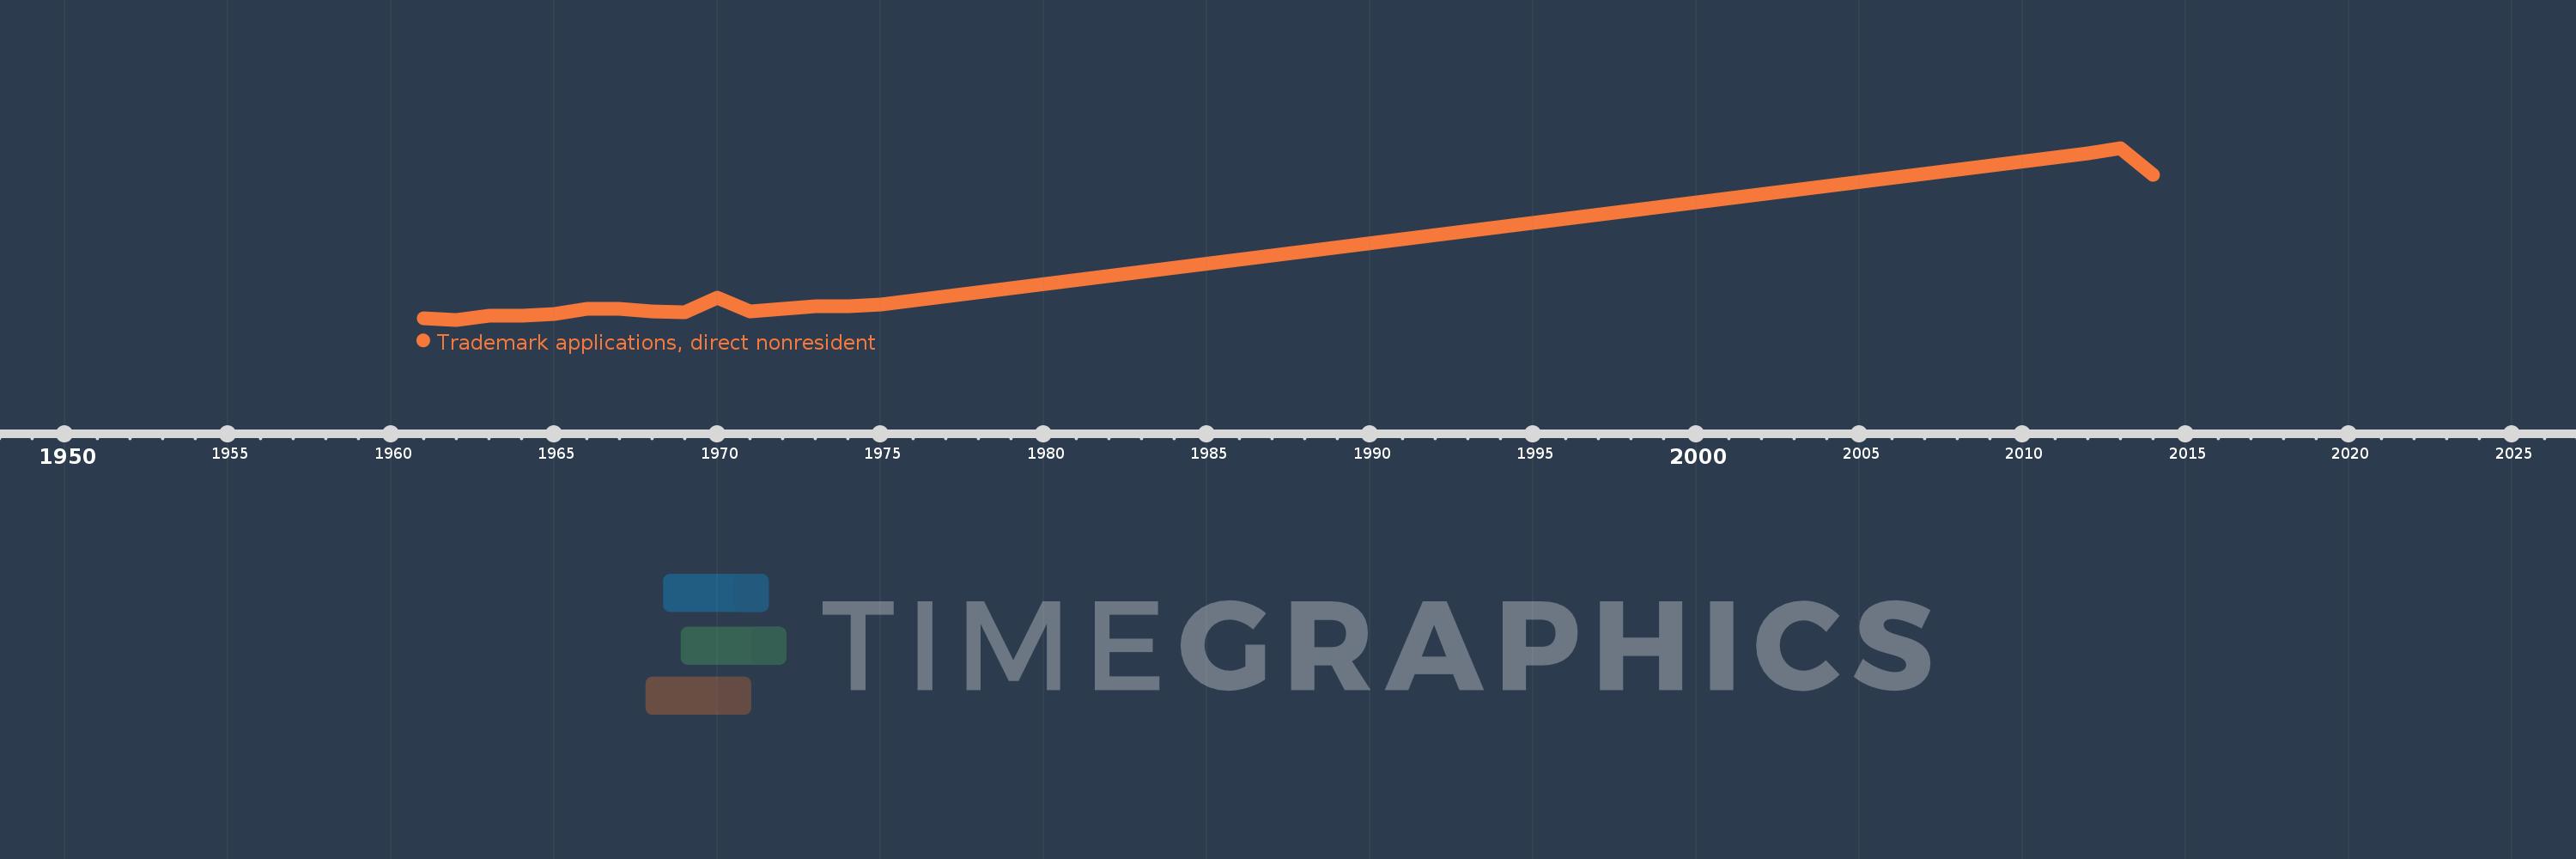
This timeline shows a graph from 1961 to 2014 of Lebanon. No data until 1960. Number of actual observations by date: 18.
Source name:
World Development Indicators
Source organization:
World Intellectual Property Organization (WIPO), WIPO Patent Report: Statistics on Worldwide Patent Activity. The International Bureau of WIPO assumes no responsibility with respect to the transformation of these data.
Categories, topics:
Science & Technology
Last updated:
apr 23, 2017
Indicators value changes by year
Meaning:
1.795K
Minimum:
897.0
jan 1, 1962
Maximum:
5.383K
jan 1, 2013
At the date of observation
Value
Absolute change
Change from the previous value
jan 1, 1961
925.0
+925.0
0.0%
jan 1, 1962
897.0
-28.0
-3.03%
jan 1, 1963
992.0
+95.0
10.59%
jan 1, 1964
997.0
+5.0
0.5%
jan 1, 1965
1.039K
+42.0
4.21%
jan 1, 1966
1.182K
+143.0
13.76%
jan 1, 1967
1.19K
+8.0
0.68%
jan 1, 1968
1.11K
-80.0
-6.72%
jan 1, 1969
1.082K
-28.0
-2.52%
jan 1, 1970
1.477K
+395.0
36.51%
jan 1, 1971
1.118K
-359.0
-24.31%
jan 1, 1972
1.188K
+70.0
6.26%
jan 1, 1973
1.253K
+65.0
5.47%
jan 1, 1974
1.247K
-6.0
-0.48%
jan 1, 1975
1.301K
+54.0
4.33%
jan 1, 2012
5.244K
+3.943K
303.07%
jan 1, 2013
5.383K
+139.0
2.65%
jan 1, 2014
4.681K
-702.0
-13.04%
Ranking of countries by current statistics by years