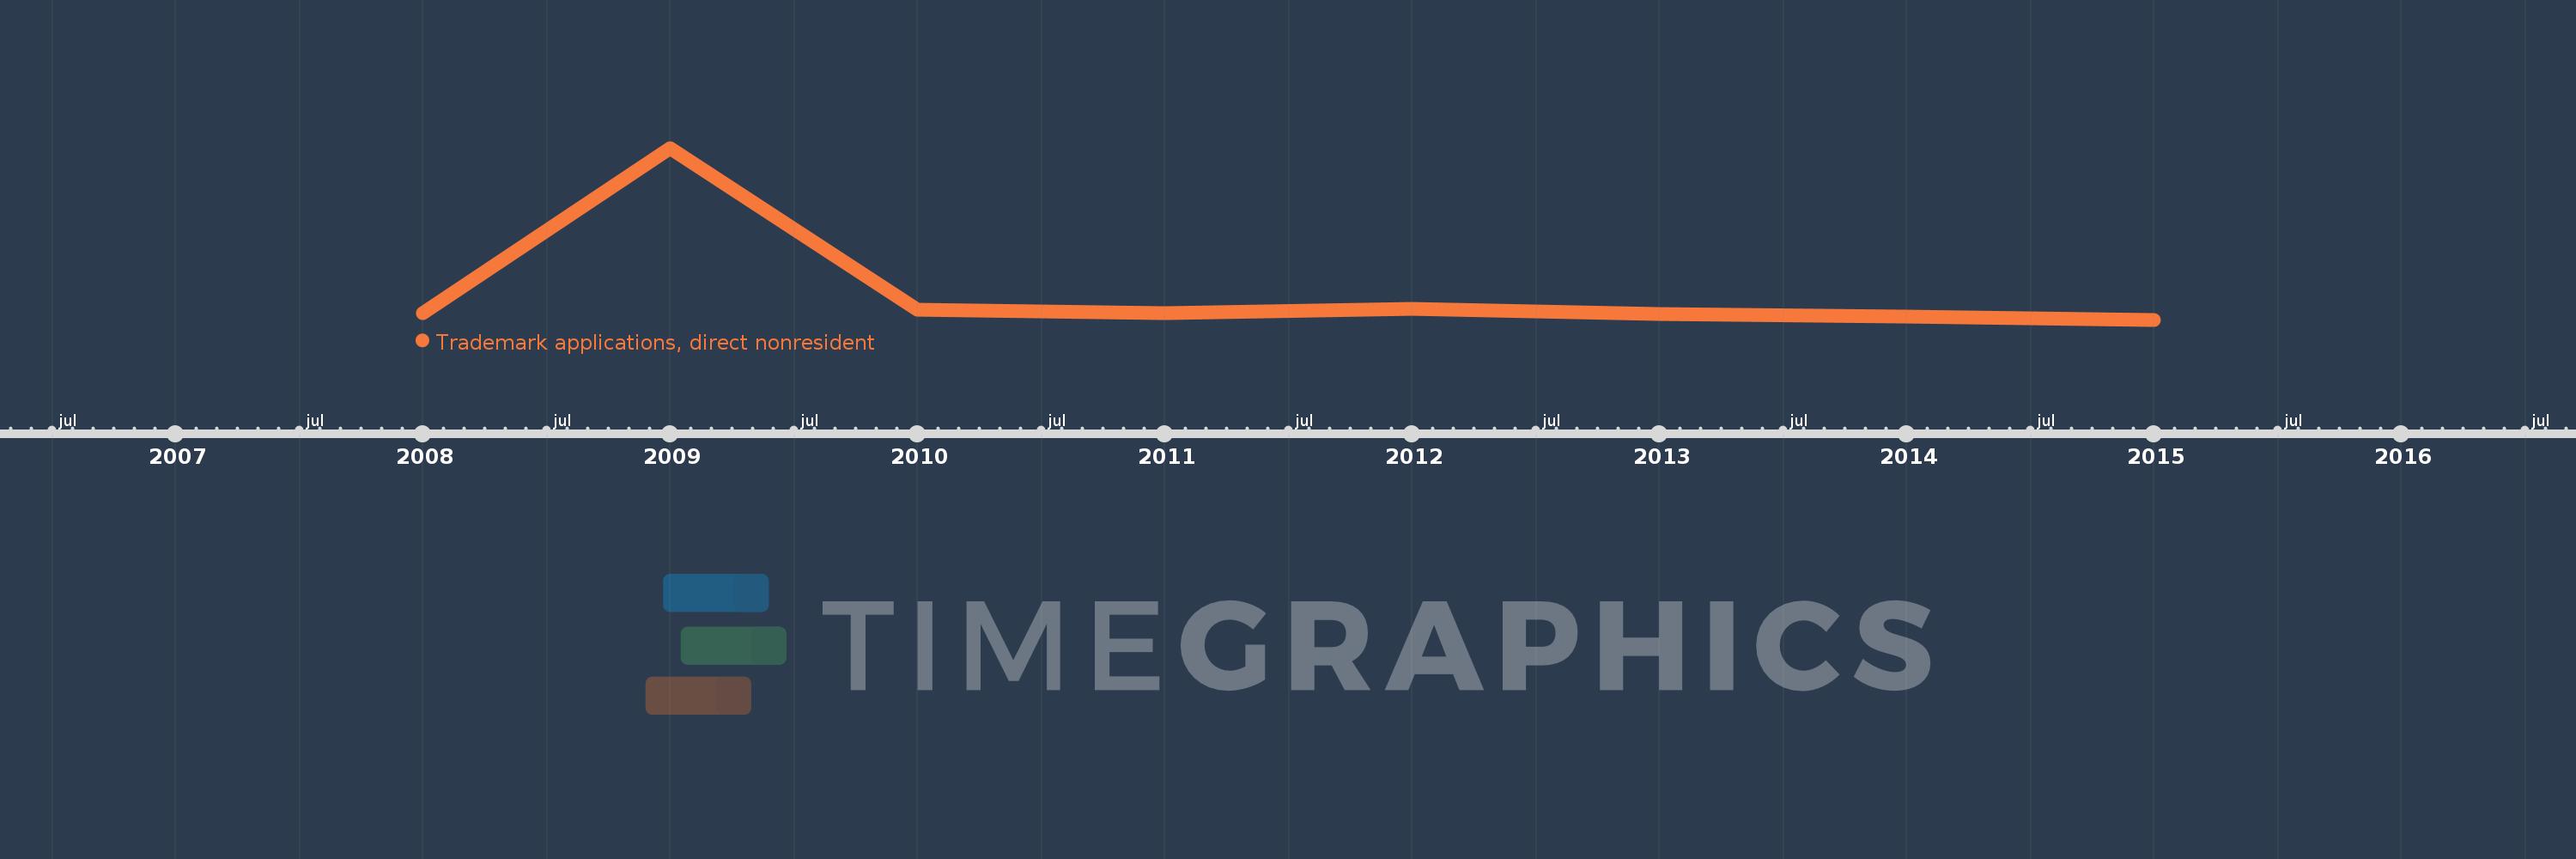
This timeline shows a graph from 2008 to 2015 of Montenegro. No data until 2007. Number of actual observations by date: 8.
Source name:
World Development Indicators
Source organization:
World Intellectual Property Organization (WIPO), WIPO Patent Report: Statistics on Worldwide Patent Activity. The International Bureau of WIPO assumes no responsibility with respect to the transformation of these data.
Categories, topics:
Science & Technology
Last updated:
apr 23, 2017
Indicators value changes by year
Meaning:
4.953K
Minimum:
3.488K
jan 1, 2015
Maximum:
12.832K
jan 1, 2009
At the date of observation
Value
Absolute change
Change from the previous value
jan 1, 2008
3.851K
+3.851K
0.0%
jan 1, 2009
12.832K
+8.981K
233.21%
jan 1, 2010
4.04K
-8.792K
-68.52%
jan 1, 2011
3.871K
-169.0
-4.18%
jan 1, 2012
4.091K
+220.0
5.68%
jan 1, 2013
3.809K
-282.0
-6.89%
jan 1, 2014
3.642K
-167.0
-4.38%
jan 1, 2015
3.488K
-154.0
-4.23%
Ranking of countries by current statistics by years