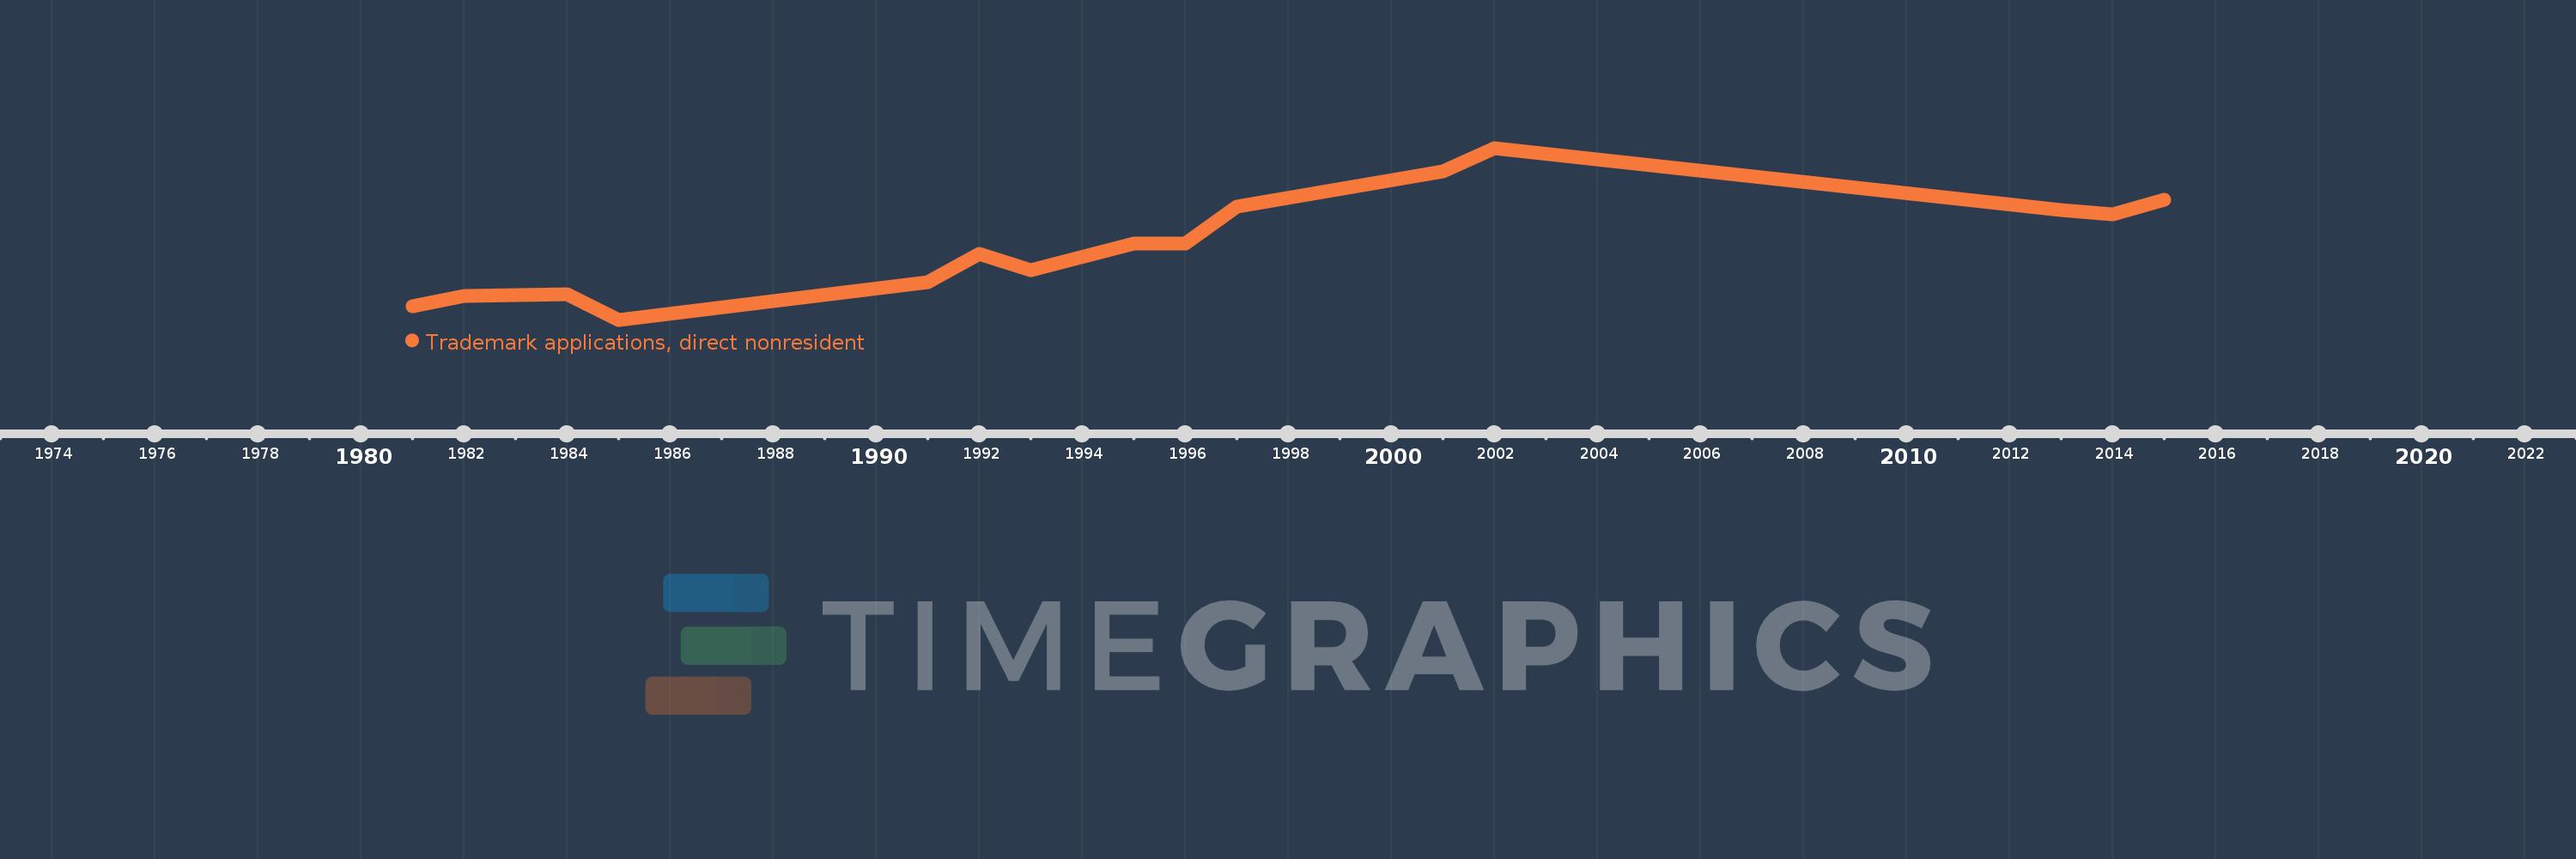
This timeline shows a graph from 1981 to 2015 of St. Lucia. No data until 1980. Number of actual observations by date: 15.
Source name:
World Development Indicators
Source organization:
World Intellectual Property Organization (WIPO), WIPO Patent Report: Statistics on Worldwide Patent Activity. The International Bureau of WIPO assumes no responsibility with respect to the transformation of these data.
Categories, topics:
Science & Technology
Last updated:
apr 23, 2017
Indicators value changes by year
Meaning:
285.933
Minimum:
87.0
jan 1, 1985
Maximum:
538.0
jan 1, 2002
At the date of observation
Value
Absolute change
Change from the previous value
jan 1, 1981
123.0
+123.0
0.0%
jan 1, 1982
150.0
+27.0
21.95%
jan 1, 1984
154.0
+4.0
2.67%
jan 1, 1985
87.0
-67.0
-43.51%
jan 1, 1991
185.0
+98.0
112.64%
jan 1, 1992
259.0
+74.0
40.0%
jan 1, 1993
217.0
-42.0
-16.22%
jan 1, 1995
287.0
+70.0
32.26%
jan 1, 1996
286.0
-1.0
-0.35%
jan 1, 1997
385.0
+99.0
34.62%
jan 1, 2001
476.0
+91.0
23.64%
jan 1, 2002
538.0
+62.0
13.03%
jan 1, 2013
376.0
-162.0
-30.11%
jan 1, 2014
363.0
-13.0
-3.46%
jan 1, 2015
403.0
+40.0
11.02%
Ranking of countries by current statistics by years