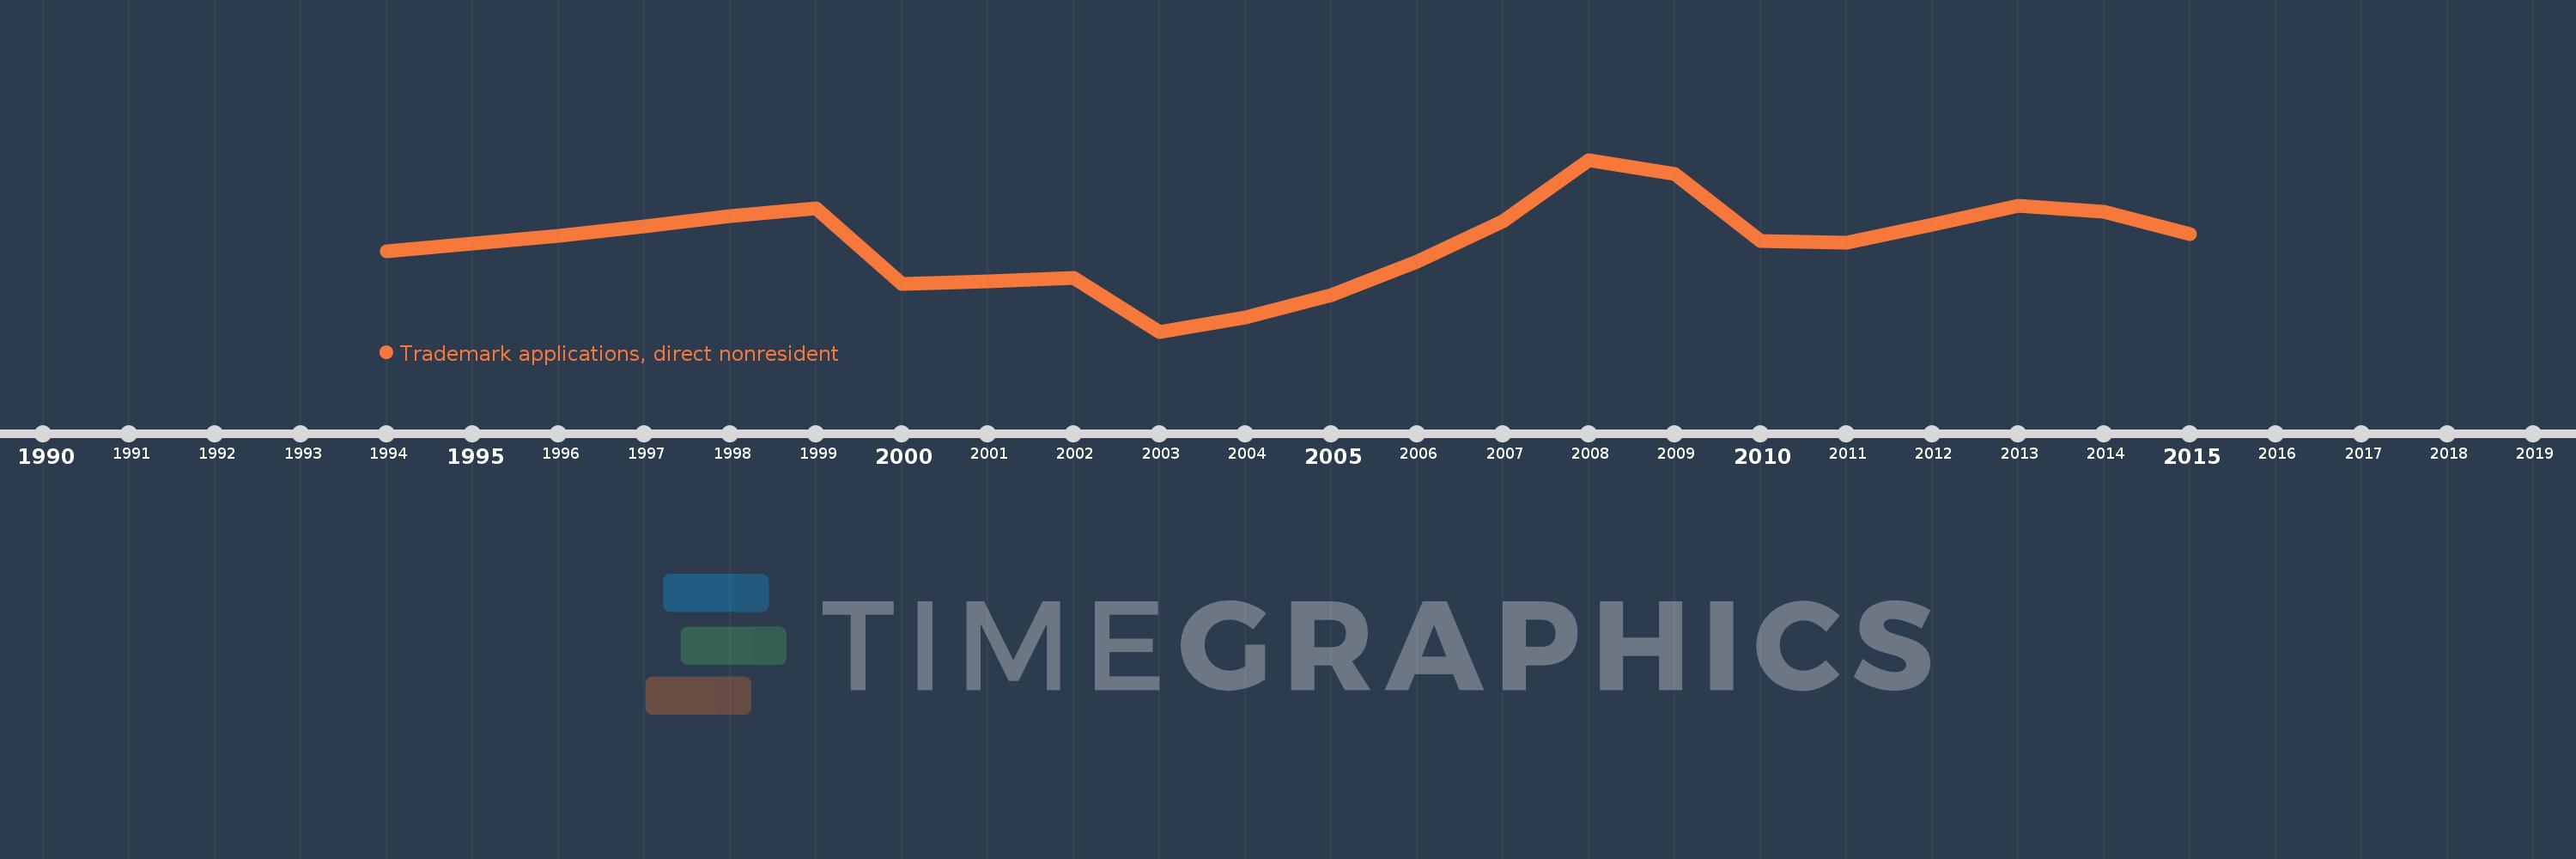
This timeline shows a graph from 1994 to 2015 of Uzbekistan. No data until 1993. Number of actual observations by date: 21.
Source name:
World Development Indicators
Source organization:
World Intellectual Property Organization (WIPO), WIPO Patent Report: Statistics on Worldwide Patent Activity. The International Bureau of WIPO assumes no responsibility with respect to the transformation of these data.
Categories, topics:
Science & Technology
Last updated:
apr 23, 2017
Indicators value changes by year
Meaning:
3.086K
Minimum:
2.166K
jan 1, 2003
Maximum:
3.948K
jan 1, 2008
At the date of observation
Value
Absolute change
Change from the previous value
jan 1, 1994
2.997K
+2.997K
0.0%
jan 1, 1996
3.157K
+160.0
5.34%
jan 1, 1997
3.261K
+104.0
3.29%
jan 1, 1998
3.368K
+107.0
3.28%
jan 1, 1999
3.441K
+73.0
2.17%
jan 1, 2000
2.662K
-779.0
-22.64%
jan 1, 2001
2.686K
+24.0
0.9%
jan 1, 2002
2.723K
+37.0
1.38%
jan 1, 2003
2.166K
-557.0
-20.46%
jan 1, 2004
2.315K
+149.0
6.88%
jan 1, 2005
2.547K
+232.0
10.02%
jan 1, 2006
2.889K
+342.0
13.43%
jan 1, 2007
3.309K
+420.0
14.54%
jan 1, 2008
3.948K
+639.0
19.31%
jan 1, 2009
3.803K
-145.0
-3.67%
jan 1, 2010
3.11K
-693.0
-18.22%
jan 1, 2011
3.088K
-22.0
-0.71%
jan 1, 2012
3.271K
+183.0
5.93%
jan 1, 2013
3.467K
+196.0
5.99%
jan 1, 2014
3.408K
-59.0
-1.7%
jan 1, 2015
3.18K
-228.0
-6.69%
Ranking of countries by current statistics by years